https://www.cmegroup.com/content/dam/cmegroup/images/common/default/article-940x600.jpg
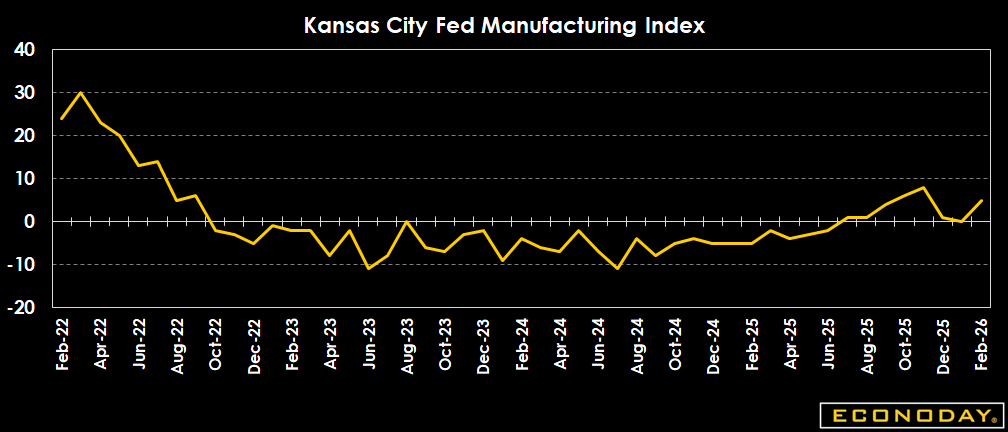
US: Kansas City Fed Manufacturing Index
| Actual | Previous | |
| Level | 5 | 0 |
Highlights
The Kansas City Fed manufacturing index is up to 5 in February after 0 in January. The index reflects modest improvement in the region's factory sector in February with rising new orders and moderation in upward price pressures. Survey respondents broadly cite ongoing concerns about prices, labor supply and quality, and an uncertain economy outlook. The manufacturing index for future conditions rises to 15 in February from 7 in January, pointing to a more positive outlook for the sector.
The index for new orders is up to 7 in February from 0 in January and is the first positive reading since 1 in September 2025. The index for order backlogs shows expansion at 8 in February and is the first increase since 1 in September 2022. New orders are coming in and a few unfilled orders suggest activity will be smoother in the next months. The index for new export orders is up to 0 in February, the first non-negative since 4 in August 2024. However, the changing landscape for tariff policy and size could send this down again.
The index for shipments rebounds to 11 in February after minus 2 in January. Winter storms may have interrupted some shipments in January. The index for delivery times is essentially unchanged at 7 in February from 8 in January. The supply chain is moving a little slower but not enough to suggest activity is heating up or that supplies are scarce.
The index for employment is at minus 6 in February after 0 in January. Hiring remains slow. One respondent comment in the report points to adoption of AI to overcome shortages of qualified workers in some cases. The average workweek index shows a pickup in hours worked at 6 in February from 4 in January. Longer hours means that current workers are getting more time on the job.
The index for finished goods inventories is about unchanged at 18 in February from 19 in January and has been relatively steady for the past year or so.
Definition
The Kansas City Fed index offers a monthly assessment of change in the region's manufacturing sector. Positive readings indicate monthly growth and negative readings monthly contraction. Readings at zero indicate no change. The headline number is the composite index, an average of the production, new orders, employment, delivery time, and raw materials inventory indexes.
Description
Investors track economic data like the Kansas City Survey of Manufacturers to understand the economic backdrop for the various markets. The stock market likes to see healthy economic growth because that translates to higher corporate profits. The bond market prefers a moderate growth environment that will not generate inflationary pressures. The survey gives a detailed look at Tenth District's manufacturing sector, how busy it is and where it is headed. Some of the survey indexes also provide insight on inflation pressures—including prices paid, prices received, wages & benefits, and capacity utilization. The equity market is also sensitive to this report because it is an early clue on the nation's manufacturing sector, reported in advance of the ISM manufacturing index and often in advance of the NAPM-Chicago index.