https://www.cmegroup.com/content/dam/cmegroup/images/common/default/article-940x600.jpg
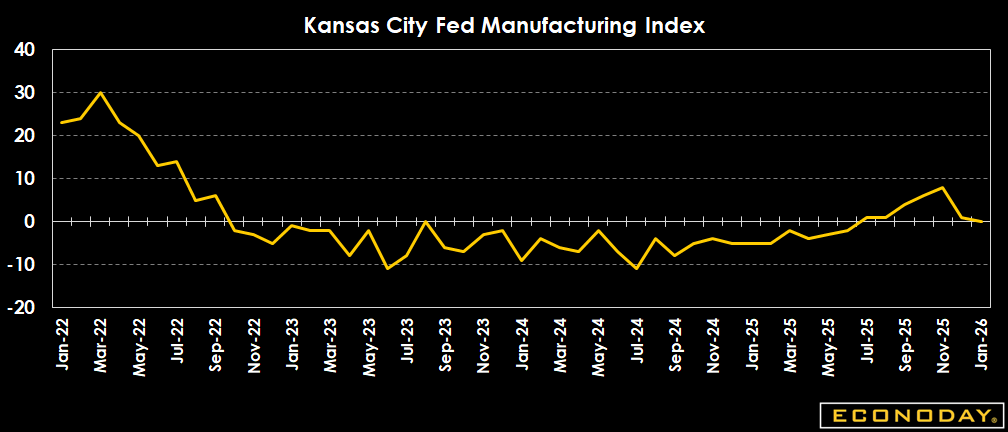
US: Kansas City Fed Manufacturing Index
| Actual | Previous | Revised | |
| Level | 0 | 1 | 0 |
Highlights
The KC Fed manufacturing report shows activity flat in January from December with the composite business activity index at 0, indicating no growth and no contraction, unchanged from a revised 0 (previously reported at 1) for December, and down from 7 in November. That suggests overall activity stalled at year end -- all these indexes are seasonally adjusted.
Among key index components of the composite: new orders is at 0 in January versus minus 2 in December and minus 2 in November. Production is at minus 2 in January versus minus 3 in December and 14 in November. Employment is at 0 after minus 4 in December and 10 in November, an uninspiring start to the new year.
On the price front, prices paid are up to 44 in January from 41 in December and 36 in November, an ugly upward trend in input costs, which are already elevated, mostly due to the tax on imported goods largely paid by US firms and consumers imposed by President Trump, the tariff man. Meanwhile, pricing power weakens with prices received at 19 in January versus 24 in December and 14 in November. The pricing figures show manufacturers in an unfortunate squeeze between rising costs and a diminishing ability to raise prices.
Definition
The Kansas City Fed index offers a monthly assessment of change in the region's manufacturing sector. Positive readings indicate monthly growth and negative readings monthly contraction. Readings at zero indicate no change. The headline number is the composite index, an average of the production, new orders, employment, delivery time, and raw materials inventory indexes.
Description
Investors track economic data like the Kansas City Survey of Manufacturers to understand the economic backdrop for the various markets. The stock market likes to see healthy economic growth because that translates to higher corporate profits. The bond market prefers a moderate growth environment that will not generate inflationary pressures. The survey gives a detailed look at Tenth District's manufacturing sector, how busy it is and where it is headed. Some of the survey indexes also provide insight on inflation pressures—including prices paid, prices received, wages & benefits, and capacity utilization. The equity market is also sensitive to this report because it is an early clue on the nation's manufacturing sector, reported in advance of the ISM manufacturing index and often in advance of the NAPM-Chicago index.