https://www.cmegroup.com/content/dam/cmegroup/images/common/default/article-940x600.jpg

US: PMI Manufacturing Final
| Consensus | Consensus Range | Actual | Previous | |
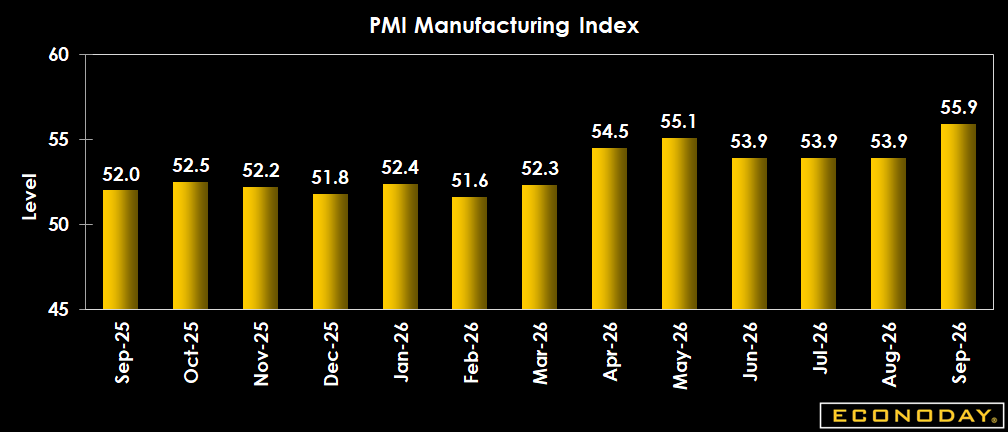
| Index | 54.8 | 53.3 to 55.2 | 55.9 | 53.9 |
Highlights
The S&P Global US Manufacturing Purchasing Managers’ Index came in at 55.9 in September, after 53.9 August, beating expectations for 54.8 in the Econoday survey of forecasters. A surge in new orders – particularly from the AI boom – gave manufacturers the confidence to increase output as well as hiring. This is the strongest reading since May 2022.
However, production capacity remains “under pressure” due to challenging supply chain conditions – lead times for input deliveries are now at their longest in over four years.
Tariffs continue to dampen foreign demand, causing exports to decline, while higher energy prices, tariffs, and key material shortages are pushing input prices up at a steep rate.
On the jobs front, “[t]he net increase in jobs was the highest in over five years as firms scrambled to expand capacity and deal with the influx of new work and existing workloads.”
As for inflation, the surge in manufacturing costs led companies to raise their own prices, albeit “to the weakest degree since February.”
Looking ahead, the outlook remains positive – although below its historical trend – due to positive order book pipelines, and expectations for market, product and commercial expansion.
Market Consensus Before Announcement
Another month of moderate expansion expected with the ISM manufacturing index seen at 54.8 versus 54.6 in August.
Definition
Based on monthly questionnaire surveys of selected companies, the Purchasing Managers' Manufacturing Index (PMI) offers an advance indication on month-to-month activity in the private sector economy by tracking changes in variables such as production, new orders, stock levels, employment and prices across manufacturing industries. The final index for the current month is released roughly a week after the flash.
Description
Investors need to keep their fingers on the pulse of the economy because it dictates how various types of investments will perform. By tracking economic data such as the ISM manufacturing index in the U.S. and the Markit PMIs in the U.S. and elsewhere, investors will know what the economic backdrop is for the various markets. The stock market likes to see healthy economic growth because that translates to higher corporate profits. The bond market prefers less rapid growth and is extremely sensitive to whether the economy is growing too quickly and causing potential inflationary pressures.
The Markit PMI manufacturing data give a detailed look at the manufacturing sector, how busy it is and where things are headed. Since the manufacturing sector is a major source of cyclical variability in the economy, this report has a big influence on the markets. And its sub-indexes provide a picture of orders, output, employment and prices.
Markit originally began collecting monthly Purchasing Managers' Index (PMI) data in the U.S. in April 2004, initially from a panel of manufacturers in the U.S. electronics goods producing sector. In May 2007, Markit's U.S. PMI research was extended out to cover producers of metal goods. In October 2009, Markit's U.S. Manufacturing PMI survey panel was extended further to cover all areas of U.S. manufacturing activity. Back data for Markit's U.S. Manufacturing PMI between May 2007 and September 2009 are an aggregation of data collected from producers of electronic goods and metal goods producers, while data from October 2009 are based on data collected from a panel representing the entire U.S. manufacturing economy. Markit's total U.S. Manufacturing PMI survey panel comprises over 600 companies.