https://www.cmegroup.com/content/dam/cmegroup/images/common/default/article-940x600.jpg

US: PMI Manufacturing Final
| Consensus | Consensus Range | Actual | Previous | |
| Index | 55.7 | 53.8 to 55.7 | 53.9 | 55.1 |
Highlights
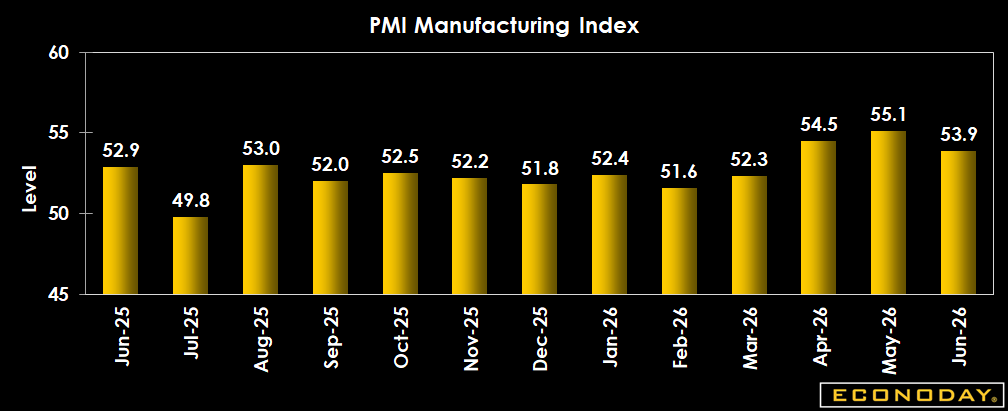
A downside miss on the S&P PMI manufacturing index at 53.9 in the final June report, down from the 55.7 June flash and 55.1 in the May final. The Econoday consensus forecast looked for no revision from the flash at 55.7 in the June final.
This is a 3-month low for the pace of growth overall but it remains a decent reading, showing ongoing moderate expansion. Output and new orders are up at slower, but still historically elevated, rates, S&P says.
S&P says,"Where firms reported higher sales, the data pointed to a continued reliance on the domestic market, as new export orders faltered again. Exports declined for the twelfth consecutive month, albeit modestly overall. Tariffs
reportedly remained the main factor behind the fall in foreign sales, while some companies also noted subdued international demand, in part linked to the war in the Middle East."
ISM manufacturing report is coming up at 10 am ET. The S&P final manufacturing report suggests downside risk for its ISM counterpart.
Market Consensus Before Announcement
The consensus looks for no revision in the June final from the June flash at 55.7, but up from 55.1 in May.
Definition
Based on monthly questionnaire surveys of selected companies, the Purchasing Managers' Manufacturing Index (PMI) offers an advance indication on month-to-month activity in the private sector economy by tracking changes in variables such as production, new orders, stock levels, employment and prices across manufacturing industries. The final index for the current month is released roughly a week after the flash.
Description
Investors need to keep their fingers on the pulse of the economy because it dictates how various types of investments will perform. By tracking economic data such as the ISM manufacturing index in the U.S. and the Markit PMIs in the U.S. and elsewhere, investors will know what the economic backdrop is for the various markets. The stock market likes to see healthy economic growth because that translates to higher corporate profits. The bond market prefers less rapid growth and is extremely sensitive to whether the economy is growing too quickly and causing potential inflationary pressures.
The Markit PMI manufacturing data give a detailed look at the manufacturing sector, how busy it is and where things are headed. Since the manufacturing sector is a major source of cyclical variability in the economy, this report has a big influence on the markets. And its sub-indexes provide a picture of orders, output, employment and prices.
Markit originally began collecting monthly Purchasing Managers' Index (PMI) data in the U.S. in April 2004, initially from a panel of manufacturers in the U.S. electronics goods producing sector. In May 2007, Markit's U.S. PMI research was extended out to cover producers of metal goods. In October 2009, Markit's U.S. Manufacturing PMI survey panel was extended further to cover all areas of U.S. manufacturing activity. Back data for Markit's U.S. Manufacturing PMI between May 2007 and September 2009 are an aggregation of data collected from producers of electronic goods and metal goods producers, while data from October 2009 are based on data collected from a panel representing the entire U.S. manufacturing economy. Markit's total U.S. Manufacturing PMI survey panel comprises over 600 companies.