https://www.cmegroup.com/content/dam/cmegroup/images/common/default/article-940x600.jpg
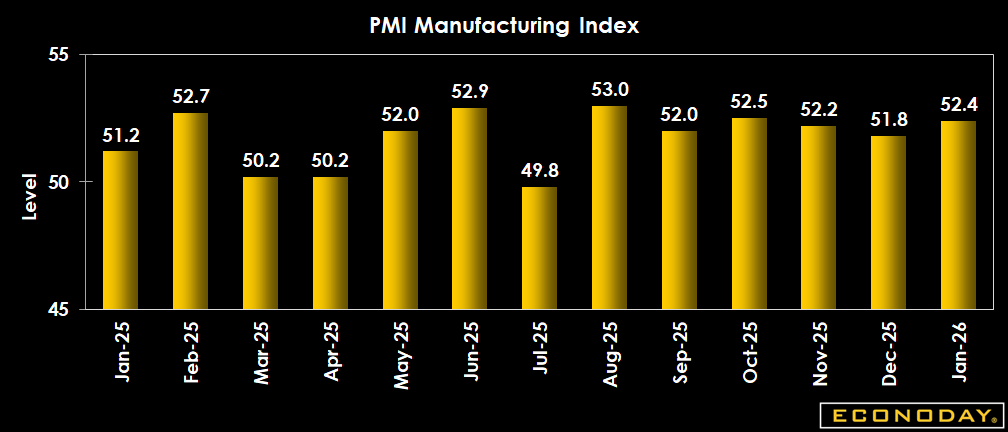
US: PMI Manufacturing Final
| Consensus | Consensus Range | Actual | Previous | |
| Index | 51.9 | 49.5 to 52.2 | 52.4 | 51.8 |
Highlights
The S&P Global US Manufacturing Purchasing Managers' Index improved to 52.4 in January, compared to 51.8 in December, and beating expectations for 51.9 in the Econoday survey of forecasters. However, inventory building primarily drove the uptick in activity, with new orders only rising modestly. Tariffs continue to dampen exports, and fuel input costs to a greater degree.
Exports remained a source of demand weakness, falling overall for the seventh month in a row, it said. Tariffs and ongoing trade uncertainties were reported to have weighed on sales, especially to South American and European clients.
[T]ariffs continued to push up input prices during January, with vendors reportedly raising their charges as a result. Input cost inflation increased from December, while manufacturers' own charges rose to the greatest extent since last August, the report added.
Looking ahead, manufacturers remain upbeat about the outlook for sales and production, tied to expectations of lower interest rates and expectations for reduced import competition. Expectations of higher output and increased present operational requirements subsequently led to a modest rise in employment, the report said.
Tariffs continued to drive up input prices in January, with vendors raising their charges as a result. Input cost inflation increased from December, while manufacturers' own charges rose to the greatest extent since last August.
On the jobs front, firms' positive outlook boosted hiring, with manufacturers generally expecting a rise in sales and output over the next 12 months. That said, geopolitical concerns and higher prices continued to weigh on the outlook overall, the report warned.
Market Consensus Before Announcement
Index expected unrevised in the January final from the January flash at 51.9 and up from 51.8 in December.
Definition
Based on monthly questionnaire surveys of selected companies, the Purchasing Managers' Manufacturing Index (PMI) offers an advance indication on month-to-month activity in the private sector economy by tracking changes in variables such as production, new orders, stock levels, employment and prices across manufacturing industries. The final index for the current month is released roughly a week after the flash.
Description
Investors need to keep their fingers on the pulse of the economy because it dictates how various types of investments will perform. By tracking economic data such as the ISM manufacturing index in the U.S. and the Markit PMIs in the U.S. and elsewhere, investors will know what the economic backdrop is for the various markets. The stock market likes to see healthy economic growth because that translates to higher corporate profits. The bond market prefers less rapid growth and is extremely sensitive to whether the economy is growing too quickly and causing potential inflationary pressures.
The Markit PMI manufacturing data give a detailed look at the manufacturing sector, how busy it is and where things are headed. Since the manufacturing sector is a major source of cyclical variability in the economy, this report has a big influence on the markets. And its sub-indexes provide a picture of orders, output, employment and prices.
Markit originally began collecting monthly Purchasing Managers' Index (PMI) data in the U.S. in April 2004, initially from a panel of manufacturers in the U.S. electronics goods producing sector. In May 2007, Markit's U.S. PMI research was extended out to cover producers of metal goods. In October 2009, Markit's U.S. Manufacturing PMI survey panel was extended further to cover all areas of U.S. manufacturing activity. Back data for Markit's U.S. Manufacturing PMI between May 2007 and September 2009 are an aggregation of data collected from producers of electronic goods and metal goods producers, while data from October 2009 are based on data collected from a panel representing the entire U.S. manufacturing economy. Markit's total U.S. Manufacturing PMI survey panel comprises over 600 companies.