https://www.cmegroup.com/content/dam/cmegroup/images/common/default/article-940x600.jpg
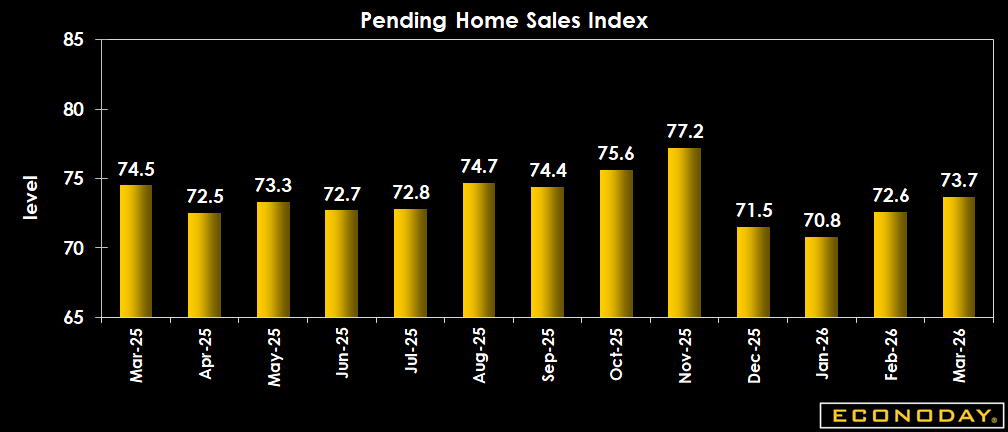
US: Pending Home Sales Index
| Consensus | Consensus Range | Actual | Previous | Revised | |
| Month over Month | 0.9% | -0.5% to 1.0% | 1.5% | 1.8% | 2.5% |
| Index | 73.7 | 72.1 | 72.6 |
Highlights
Sales top expectations with an increase of 1.5 percent in March from February while sales for February were revised up to show an increase of 2.5 percent versus the 1.8 percent increase previously reported.
These are strong gains, taken together. Econoday's consensus expectations for March called for a smaller 0.9 percent rise from February. Sales remain down 1.1 percent in March from a year ago, however.
The National Association of Realtors notes that the uptick in March occurred in spite of higher mortgage rates and says this shows pent-up demand for housing that should lead to more increases in sales as more inventory comes on line.
By region, sales are split on the month with gains in Northeast and South and declines in the Midwest and West. The NAR said sales in the South are likely to show the best gains this year as job growth has been strongest there while price cuts have been occurring too.
Market Consensus Before Announcement
The consensus sees sales up 0.9 percent in March, building on the 1.8 percent rise in February.
Definition
The National Association of Realtors developed the pending home sales index as a leading indicator of housing activity. Specifically, it is a leading indicator of existing home sales, not new home sales. A pending sale is one in which a contract was signed, but not yet closed. It usually takes four to six weeks to close a contracted sale.
Description
This provides a gauge of not only the demand for housing, but the economic momentum. People have to be feeling pretty comfortable and confident in their own financial position to buy a house. Furthermore, this narrow piece of data has a powerful multiplier effect through the economy, and therefore across the markets and your investments. By tracking economic data such as the pending home sales index which measures home resales, investors can gain specific investment ideas as well as broad guidance for managing a portfolio.
Even though home resales don't always create new output, once the home is sold, it generates revenues for the realtor. It brings a myriad of consumption opportunities for the buyer. Refrigerators, washers, dryers and furniture are just a few items home buyers might purchase. The economic"ripple effect" can be substantial especially when you think a hundred thousand new households around the country are doing this every month.
Since the economic backdrop is the most pervasive influence on financial markets, home resales have a direct bearing on stocks, bonds and commodities. In a more specific sense, trends in the existing home sales data carry valuable clues for the stocks of home builders, mortgage lenders and home furnishings companies.
The National Association of Realtors moved up its publication schedule in 2011. Prior to 2011, the reference month was two months trailing the release date. In 2011, the reference month trails only by one month to the release month.