https://www.cmegroup.com/content/dam/cmegroup/images/common/default/article-940x600.jpg
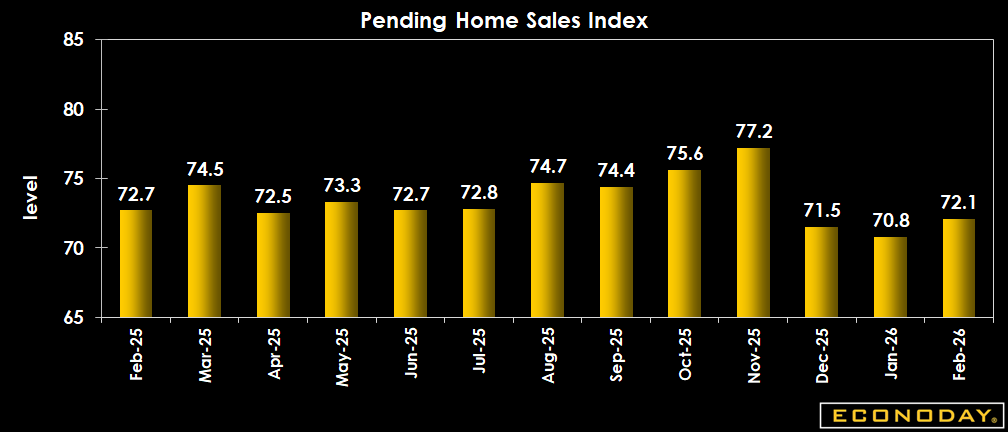
US: Pending Home Sales Index
| Consensus | Consensus Range | Actual | Previous | Revised | |
| Month over Month | -1.0% | -1.0% to 0.2% | 1.8% | -0.8% | -1.0% |
| Index | 72.1 | 70.9 | 70.8 |
Highlights
The NAR's pending home sales index for February rises 1.8 percent to 72.1 after a negligible downward revision to 70.8 in January. The index is 0.8 percent than a year ago. The February reading is above the consensus of down 1.0 percent in the Econoday survey of forecasters. The February increase is likely due to further declines in mortgage rates, and some rebound after severe winter storms kept homebuyers out of the market in January. Across regions, the pending home sales index is down 3.6 percent in the Northeast, up 4.6 percent in the Midwest, up 2.7 percent in the South, and up 0.9 percent in the West.
Homebuyers remain sensitive to interest rates which factor into home affordability. Prices remain elevated and the supply of the most sought-after homes is limited. The average monthly rate for a Freddie Mac 30-year fixed rate mortgage is down to 6.11 percent in January and February, the lowest rates since 6.11 percent in September 2022. Price appreciation in the post-pandemic period means that many homebuyers are having difficulty in saving enough for a downpayment and qualifying for a mortgage. Many are turning to adjustable rate mortgages as an alternative to keep initial monthly payments down.
Market Consensus Before Announcement
Sales depressed, expected down 1.0 percent on month in February after a decline of 0.8 percent in January.
Definition
The National Association of Realtors developed the pending home sales index as a leading indicator of housing activity. Specifically, it is a leading indicator of existing home sales, not new home sales. A pending sale is one in which a contract was signed, but not yet closed. It usually takes four to six weeks to close a contracted sale.
Description
This provides a gauge of not only the demand for housing, but the economic momentum. People have to be feeling pretty comfortable and confident in their own financial position to buy a house. Furthermore, this narrow piece of data has a powerful multiplier effect through the economy, and therefore across the markets and your investments. By tracking economic data such as the pending home sales index which measures home resales, investors can gain specific investment ideas as well as broad guidance for managing a portfolio.
Even though home resales don't always create new output, once the home is sold, it generates revenues for the realtor. It brings a myriad of consumption opportunities for the buyer. Refrigerators, washers, dryers and furniture are just a few items home buyers might purchase. The economic"ripple effect" can be substantial especially when you think a hundred thousand new households around the country are doing this every month.
Since the economic backdrop is the most pervasive influence on financial markets, home resales have a direct bearing on stocks, bonds and commodities. In a more specific sense, trends in the existing home sales data carry valuable clues for the stocks of home builders, mortgage lenders and home furnishings companies.
The National Association of Realtors moved up its publication schedule in 2011. Prior to 2011, the reference month was two months trailing the release date. In 2011, the reference month trails only by one month to the release month.