https://www.cmegroup.com/content/dam/cmegroup/images/common/default/article-940x600.jpg
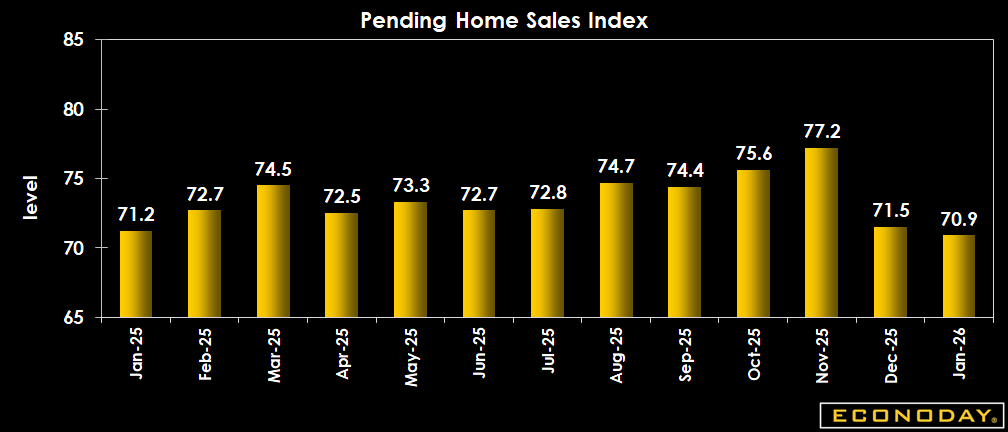
US: Pending Home Sales Index
| Consensus | Consensus Range | Actual | Previous | Revised | |
| Month over Month | 2.5% | 0.2% to 6.5% | -0.8% | -9.3% | -7.4% |
| Index | 70.9 | 71.8 | 71.5 |
Highlights
The NAR's pending home sales index for January dips 0.8 percent to 70.9 after 71.5 in December and is below 71.2 in January 2025. The decrease is well below the Econoday survey of forecasters consensus of an increase of 2.5 percent in January. The report includes annual revisions.
Pending home sales are contracts signed but not yet closed. The weakness may in part be a story of the weather as bitter cold and icy storms hit large parts of the US in January. The impact was more severe in the Northeast and South which are generally less accustomed to this type of weather. Regionally, the index for the Northeast is down 5.7 percent in January from December and the index for the South is down 4.5 percent. Where the weather was less of a factor, declines in mortgage rates may have encouraged some sales activity. The index for the Midwest is up 5.0 percent and the West is up 4.3 percent. The month average rate for a Freddie Mac 30-year fixed rate mortgage declines from 6.24 percent in November to 6.19 percent in December and 6.11 percent in January. Contracts taken out in January would be from mortgage qualifications in December and January.
Low pending home sales in January point to weaker sales of existing homes in February when those contracts are closed. However, lower mortgage rates make home purchases more affordable provided buyers can find the right unit at the right price. There is the potential for a strong spring buying season if there is enough supply on the market. This will depend on current homeowners listing their units for sales as well as homebuilders increasing construction.
Market Consensus Before Announcement
Pending home sales are seen rebounding by 2.5 percent in January after dropping 9.3 percent in December.
Definition
The National Association of Realtors developed the pending home sales index as a leading indicator of housing activity. Specifically, it is a leading indicator of existing home sales, not new home sales. A pending sale is one in which a contract was signed, but not yet closed. It usually takes four to six weeks to close a contracted sale.
Description
This provides a gauge of not only the demand for housing, but the economic momentum. People have to be feeling pretty comfortable and confident in their own financial position to buy a house. Furthermore, this narrow piece of data has a powerful multiplier effect through the economy, and therefore across the markets and your investments. By tracking economic data such as the pending home sales index which measures home resales, investors can gain specific investment ideas as well as broad guidance for managing a portfolio.
Even though home resales don't always create new output, once the home is sold, it generates revenues for the realtor. It brings a myriad of consumption opportunities for the buyer. Refrigerators, washers, dryers and furniture are just a few items home buyers might purchase. The economic"ripple effect" can be substantial especially when you think a hundred thousand new households around the country are doing this every month.
Since the economic backdrop is the most pervasive influence on financial markets, home resales have a direct bearing on stocks, bonds and commodities. In a more specific sense, trends in the existing home sales data carry valuable clues for the stocks of home builders, mortgage lenders and home furnishings companies.
The National Association of Realtors moved up its publication schedule in 2011. Prior to 2011, the reference month was two months trailing the release date. In 2011, the reference month trails only by one month to the release month.