https://www.cmegroup.com/content/dam/cmegroup/images/common/default/article-940x600.jpg
US: Industrial Production
| Consensus | Consensus Range | Actual | Previous | Revised | |
| Industrial Production - M/M | 0.2% | 0.0% to 0.5% | 0.1% | 0.7% | 0.9% |
| Capacity Utilization Rate | 76.2% | 76.0% to 76.3% | 76.2% | 76.1% | |
| Manufacturing Output - M/M | 0.3% | 0.3% to 0.3% | 0.0% | 0.6% | 0.7% |
Highlights
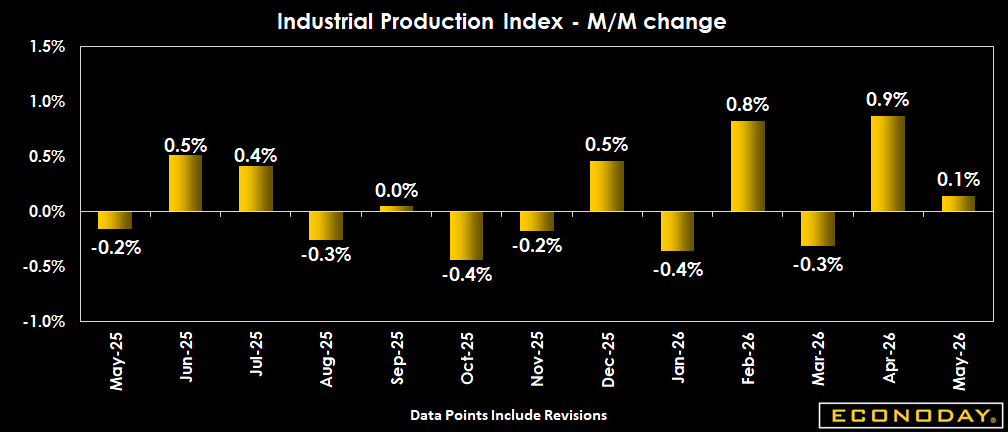
Slowdown in the rate of U.S. May industrial production, which in keeping with the yo-yo readings of the prior four months maintains an overall modest pace so far in 2026. The capability utilization rate rose, but remains below the long-term average, following no revision for the prior month.
Industrial production comes in up 0.1 percent for May after a revised 0.9 percent jump in April (revised from +0.7 percent), below expectations for +0.2 percent in the Econoday survey of forecasters. Manufacturing output was flat, utilities activity contracted, while mining output expanded.
Manufacturing output was unchanged percent in May after a 0.7 percent rise in April (revised from +0.6 percent) a pause in the steady growth in activity so far this year following December's 0.1 percent dip. Within manufacturing, durable goods output increased 0.8 percent and nondurable goods production declined by 0.9 percent in May.
Manufacturing output is 1.4 percent higher compared to a year ago.
The major market groups posted mixed performances in May. Consumer goods output fell 0.6 percent, erasing some of the 1.2 percent rise the previous month and is down 0.5 percent from May 2025.
Business equipment production rose 0.6 percent. The output of construction supplies jumped 1.1 percent, while business supplies was unchanged. The production of materials rose 0.3 percent.
Mining output rose 1.3 percent on the month, while utilities shrank by 0.4 percent.
Capacity utilization was 76.2 percent in May vs. 76.1 percent in April (unrevised). This is 3.2 percentage points below the long-term average but higher than the 75.9 percent capacity utilization rate in the same month a year ago.
Market Consensus Before Announcement
Forecasters see modest increases of 0.2 percent for industrial output and 0.3 percent for manufacturing in May. Business equipment spending as part of the AI boom continues to underpin output.
Definition
The Federal Reserve's monthly index of industrial production and the related capacity indexes and capacity utilization rates cover manufacturing, mining, and electric and gas utilities. The industrial sector, together with construction, accounts for the bulk of the variation in national output over the course of the business cycle. The production index measures real output and is expressed as a percentage of real output in a base year, currently 2012. The capacity index, which is an estimate of sustainable potential output, is also expressed as a percentage of actual output in 2012. The rate of capacity utilization equals the seasonally adjusted output index expressed as a percentage of the related capacity index.
The index of industrial production is available nationally by market and industry groupings. The major groupings are comprised of final products (such as consumer goods, business equipment and construction supplies), intermediate products and materials. The industry groupings are manufacturing (further subdivided into durable and nondurable goods), mining and utilities. The capacity utilization rate -- reflecting the resource utilization of the nation's output facilities -- is available for the same market and industry groupings.
Industrial production was also revised to NAICS (North American Industry Classification System) in the early 2000s. Unlike other economic series that lost much historical data prior to 1992, the Federal Reserve Board was able to reconstruct historical data that go back more than 30 years.
Description
Investors want to keep their finger on the pulse of the economy because it usually dictates how various types of investments will perform. The stock market likes to see healthy economic growth because that translates to higher corporate profits. The bond market prefers more subdued growth that won't lead to inflationary pressures. By tracking economic data such as industrial production, investors will know what the economic backdrop is for these markets and their portfolios.
The index of industrial production shows how much factories, mines and utilities are producing. The manufacturing sector accounts for less than 20 percent of the economy, but most of its cyclical variation. Consequently, this report has a big influence on market behavior. In any given month, one can see whether capital goods or consumer goods are growing more rapidly. Are manufacturers still producing construction supplies and other materials? This detailed report shows which sectors of the economy are growing and which are not.
The capacity utilization rate provides an estimate of how much factory capacity is in use. If the utilization rate gets too high (above 85 percent), it can lead to inflationary bottlenecks in production. The Federal Reserve watches this report closely and sets interest rate policy on the basis of whether production constraints are threatening to cause inflationary pressures. As such, the bond market can be highly sensitive to changes in the capacity utilization rate. In this global environment, though, global capacity constraints may matter as much as domestic capacity constraints.
Importance
Industrial production and capacity utilization indicate not only trends in the manufacturing sector, but also whether resource utilization is strained enough to forebode inflation. Also, industrial production is an important measure of current output for the economy and helps to define turning points in the business cycle (start of recession and start of recovery).
Interpretation
The bond market will rally with slower production and a lower utilization rate. Bond prices will fall when production is robust and the capacity utilization rate suggests supply bottlenecks. Healthy production growth is bullish for the stock market only if it isn't accompanied by indications of inflationary pressures.
The production of services may have gained prominence in the United States, but the production of manufactured goods remains a key to the economic business cycle. A nation's strength is judged by its ability to produce domestically those goods demanded by its residents as well as by importers. Many services are necessities of daily life and would be purchased whether economic conditions were weak or strong. Consumer durable goods and capital equipment are more likely purchased when the economy is robust. Production of manufactured goods causes volatility in the economy. When demand for manufactured goods decreases, it leads to less production with corresponding declines in employment and income.
The three most significant sectors include motor vehicles and parts, aircraft and information technology. Volatility in any these single sectors could affect the total.
Industrial production is subject to some monthly variation. As with all economic statistics, the three-month moving average of the monthly changes or year over year percent changes provide a clearer picture of the trend in this series.