https://www.cmegroup.com/content/dam/cmegroup/images/common/default/article-940x600.jpg

US: Empire State Manufacturing Index
| Consensus | Consensus Range | Actual | Previous | |
| Index | 8.6 | 4.0 to 11.5 | 15.6 | 5.7 |
Highlights
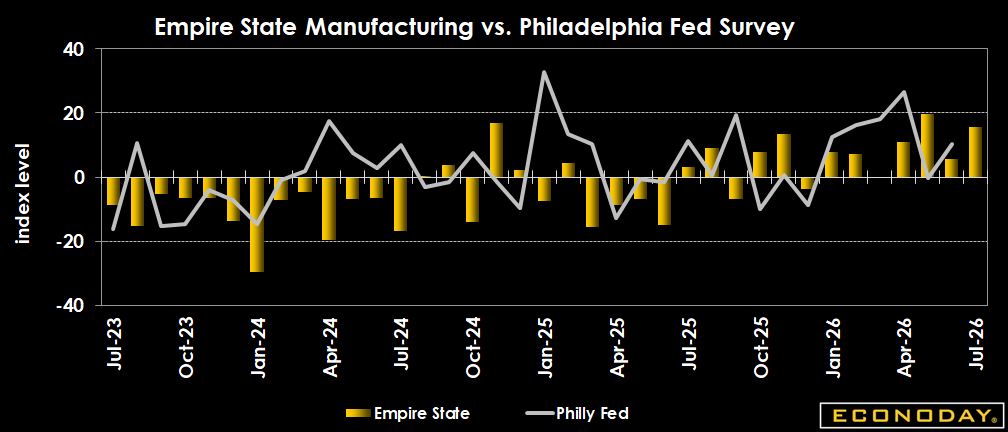
The Empire index beats expectations at 15.6 in July versus the uptick to 8.6 anticipated in the Econoday consensus forecast, and up nicely from 5.7 in June.
New orders is notably stronger at 22.2 in July versus 3.5 in June, a sign of better business ahead. Employment gains to 11.4 in July from 9.6, a sign of rising business confidence.
Prices paid is a little lower at 52.3 versus 61.0 but it remains serious elevated, suggesting ongoing heavy input price pressure.
Not a blowout reading but shows ongoing, improving business conditions and business activity. Lower energy prices in early July no doubt helping. Unclear what happens with energy prices back up in second half of the month.
Market Consensus Before Announcement
The manufacturing index is expected to show slightly faster expansion at 8.6 in July versus 5.7 in June.
Definition
The New York Fed conducts this monthly survey of manufacturers in New York State. Participants from across the state represent a variety of industries. On the first of each month, the same pool of roughly 200 manufacturing executives (usually the CEO or the president) is sent a questionnaire to report the change in an assortment of indicators from the previous month. Respondents also give their views about the likely direction of these same indicators six months ahead.
Description
Investors track economic data like the Empire State Manufacturing Survey to understand the economic backdrop for the various markets. The stock market likes to see healthy economic growth because that translates to higher corporate profits. The bond market prefers a moderate growth environment that won't generate inflationary pressures. The Empire Manufacturing Survey gives a detailed look at New York state's manufacturing sector, how busy it is and where things are headed. Since manufacturing is a major sector of the economy, this report has a big influence on the markets. Some of the Empire State Survey sub-indexes also provide insight on commodity prices and other clues on inflation. The Federal Reserve closely watches this report because when inflation signals are flashing, policymakers can reset the direction of interest rates. As a consequence, the bond market can be highly sensitive to this report. The equity market is also sensitive to this report because it is the first clue on the nation's manufacturing sector, reported in advance of the Philadelphia Fed's business outlook survey.