https://www.cmegroup.com/content/dam/cmegroup/images/common/default/article-940x600.jpg
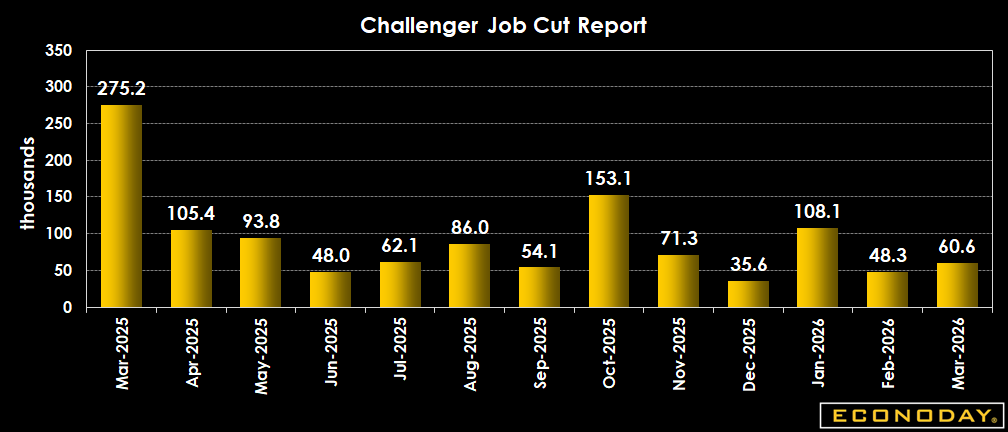
US: Challenger Job-Cut Report
| Actual | Previous | |
| Level | 60,620 | 48,307 |
Highlights
Job cut intentions rise 25.5 percent in March to 60,620 from 48,307 in February but are down 78.0 percent from 275,240 in March 2025. Planned job cuts of 18,720 in the tech sector account for 30.9 percent of all planned cuts. Business investment in artificial intelligence continues to drive reductions in force in technology. In March, the most cited reason for cutting jobs is 15,341 related to AI.
For the first three months of 2026 there are 217,362 job cuts announced compared to 497,052 in the same period in 2025. However, the year-to-date planned cuts in government jobs is 2,270 so far in 2026 compared to 217,607 in 2025. Excluding the government jobs in 2025, the year-to-date total of 217,607 looks quite similar to 2026.
Hiring plans jump 157.4 percent to 32,826 in March from 12,755 in February and are up 55.6 percent from 13,198 in March 2025. Hiring intentions reflect preparations for the spring holiday period at 8,071, while hiring is firming for aerospace/defense at 5,450 and government at 4,203.
Definition
This monthly report counts and categorizes announcements of corporate layoffs based on mass layoff data from state departments of labor. The job-cut report must be analyzed with caution. It doesn't distinguish between layoffs scheduled for the short-term or the long term, or whether job cuts are handled through attrition or actual layoffs. Also, the job-cut report does not include jobs eliminated in small batches over a longer time period. Unlike most economic data, this series is not adjusted for seasonal variation.
Description
The job-cut report is basically a rehash of the weekly jobless claims report but provides additional insight into where layoffs are occurring. There is industry and geographic (states) detail that is not available with weekly jobless claims.