| Consensus | Consensus Range | Actual | Previous | Revised | |
| Retail Sales - M/M | 0.4% | -0.1% to 1.0% | 0.6% | -0.2% | -0.1% |
| Ex-Vehicles - M/M | 0.3% | -0.1% to 0.4% | 0.5% | 0.0% | |
| Ex-Vehicles & Gas - M/M | 0.2% | 0.2% to 0.3% | 0.4% | 0.3% | 0.2% |
Highlights
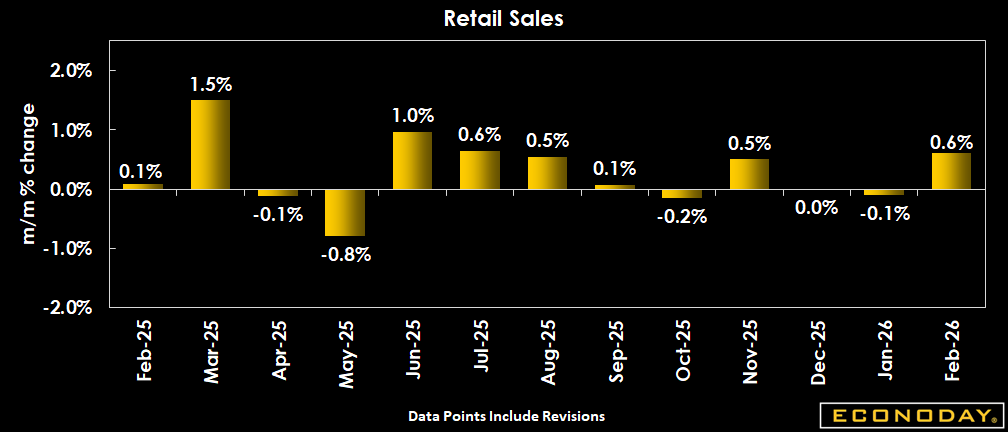
Retail and food services ales rebounded in February after severe winter weather reduced consumer spending on nonessentials in January. This suggests that consumer spending will be moderate for the first quarter 2026. The February increase may also reflect the arrival of tax refunds that are a little larger than last year. The average IRS refund issued in the February 20 week was $3,804 compared to $3,453 in the February 21, 2025 week.
Retail sales are up 0.6 percent in February from January after dipping 0.1 percent in January from December. The February rise is above the consensus of up 0.4 percent in the Econoday survey of forecasters. In particular sales got a boost from a 1.2 percent gain in motor vehicles in February after a drop of 0.7 percent in January. Retail sales excluding motor vehicles is up 0.5 percent in February after no change in January. The February consensus is up 0.3 percent. Motor vehicle sales account for 18.9 percent of total retail sales.
Gasoline prices are a bit higher in February from January and account for 0.9 percent increase in the dollar value of sales. Excluding motor vehicles and gasoline, retail sales are up 0.4 percent in February after up 0.2 percent in January. Gasoline accounts for 7.1 percent of total retail sales.
Outside of gasoline and motor vehicles, sales were generally higher except for declines of 1.0 percent in furniture, 1.0 percent in food and beverages, and no change at general merchandise stores.
Sales at nonstore retailers account for 18 percent of total retail sales in February and January as shoppers went online during the bitter cold weather. Nonstore retailer sales are up 0.7 percent in February and 1.5 percent in January.
Market Consensus Before Announcement
The consensus looks for retail sales up 0.4 percent in February with sales ex-autos up 0. percent.
* Originally scheduled for 3/16/2026
Definition
Retail sales measure the total receipts at stores that sell merchandise and related services to final consumers. Sales are by retail and food services stores. Data are collected from the Monthly Retail Trade Survey conducted by the U.S. Bureau of the Census. Essentially, retail sales cover the durables and nondurables portions of consumer spending. Consumer spending typically accounts for about two-thirds of GDP and is therefore a key element in economic growth. Of special attention is the control group; this is an input into the consumer spending component of GDP and excludes food services, autos, gasoline and building materials.
Description
Consumer spending accounts for more than two-thirds of the economy, so if you know how the consumer sector is faring, you'll have a pretty good handle on where the economy is headed. Needless to say, that's a big advantage for investors.
The pattern in consumer spending is often the foremost influence on stock and bond markets. For stocks, strong economic growth translates to healthy corporate profits and higher stock prices. For bonds, the focus is whether economic growth becomes excessive and leads to inflation. Ideally, the economy walks that fine line between strong growth and excessive (inflationary) growth. Retail sales not only give you a sense of the big picture, but also the trends among different types of retailers. Perhaps auto sales are especially strong or apparel sales are showing exceptional weakness. These trends from the retail sales data can help you spot specific investment opportunities, without having to wait for a company's quarterly or annual report.
Balance was achieved through much of the nineties. For this reason alone, investors in the stock and bond markets enjoyed huge gains during the bull market of the 1990s. Retail sales growth did slow down in tandem with the equity market in 2000 and 2001, but then rebounded at a healthy pace between 2003 and 2005. By 2007, the credit crunch was well underway and starting to undermine growth in consumer spending. Later in 2008 and 2009, the rise in unemployment and loss of income during the recession also cut into retail sales. Spending rebounded in 2010 and 2011 but was constrained by lingering high unemployment.
Importance
Retail sales are a major indicator of consumer spending trends because they account for nearly one-half of total consumer spending and approximately one-third of aggregate economic activity. The control group for retail sales (which excludes restaurants, vehicles, gasoline and building materials) is an input into GDP and offers a narrower look at nondiscretionary spending.
Interpretation
Strong retail sales are bearish for the bond market, but favorable for the stock market, particularly retail stocks. Sluggish retail sales could lead to a bond market rally, but will probably be bearish for the stock market.
Retail sales are subject to substantial month-to-month variability. In order to provide a more accurate picture of the consumer spending trend, follow the three-month moving average of the monthly percent changes or the year-over-year percent change. Retail sales are also subject to substantial monthly revisions, which makes it more difficult to discern the underlying trend. This problem underscores the need to monitor the moving average rather than just the latest one month of data.
In an attempt to avoid the more extreme volatility, economists and financial market participants monitor retail sales less autos (actually less auto dealers which include trucks, too.) Motor vehicle sales are excluded not because they are irrelevant, but because they fluctuate more than overall retail sales. In recent years, many analysts consider the core series to be total less autos and less gasoline service station sales. The latter is volatile due to swings in oil and gasoline prices.
Price changes affect the real value of retail sales. Watch for changes in food and energy prices which could affect two large components among nondurable goods stores: food stores and gasoline service stations. Large declines in food or energy prices could lead to declines in store sales which are due to price, not volume. This would mean that real sales were stronger than nominal dollar sales.
Since economic performance depend on real, rather than nominal growth rates, compare the trend growth rate in retail sales to that in the CPI for commodities.