| Consensus | Consensus Range | Actual | Previous | Revised | |
| PPI-FD - M/M | -0.1% | -0.3% to 0.6% | -0.3% | 1.1% | 0.6% |
| PPI-FD - Y/Y | 6.2% | 6.1% to 6.6% | 5.5% | 6.5% | |
| Ex-Food & Energy - M/M | 0.4% | 0.1% to 0.5% | 0.2% | 0.4% | 0.1% |
| Ex-Food & Energy - Y/Y | 5.2% | 4.9% to 5.2% | 4.7% | 4.9% | |
| Ex-Food, Energy & Trade Services - M/M | 0.4% | 0.3% to 0.4% | 0.1% | 0.8% | |
| Ex-Food, Energy & Trade Services - Y/Y | 5.1% | 5.1% | |||
| PPI-FD Goods - M/M change | -1.4% | 2.8% | 2.3% | ||
| PPI-FD Goods - Y/Y change | 7.9% | 10.4% | |||
| PPI-FD Services - M/M change | 0.2% | 0.3% | -0.1% | ||
| PPI-FD Services - Y/Y change | 4.6% | 4.9% |
Highlights
June wholesale prices contracted by more than expected – dragged down by the biggest decline in prices for final demand goods since July 2022. The deflationary impact of the brief pause Iran War is clear – energy prices fell (although they remain elevated compared to June 2025), with a domino effect on other categories such as plastic resins and materials. In terms of the knock-on effects of tariffs, as transportation and warehousing services costs declined for the first time this year but remain sky-high compared to a year ago.
This report, combined with numerous downward revisions to May as well as the cool June CPI data, eases pressure on the Fed in the near-term. However, the resumption of hostilities in the Middle East means the relief is likely to be temporary.
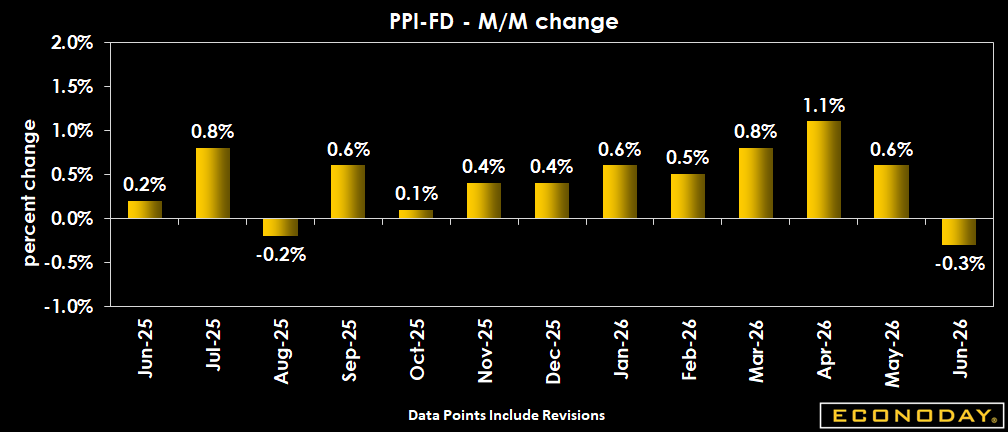
U.S. wholesale price inflation as measured by the Producer Price Index for final demand fell 0.3 percent in June, partially offsetting a revised 0.6 percent rise (previously +1.1 percent) in May, and below expectations for a 0.1 percent dip in the Econoday survey of forecasters. Final demand prices were up 1.1 percent in April and +0.8 percent in March.
Compared to June 2025, final demand PPI surged 5.5 percent, compared to a 6.5 percent increase for the 12 months ended in May. Expectations were for a 6.2 percent rise.
June final demand prices excluding food and energy came in up 0.2 percent, following a 0.1 percent rise in May, and are up 4.7 percent from a year ago after a 4.9 percent rise in May.
Final demand prices excluding foods, energy, and trade services saw a 0.1 percent uptick in June, following a 0.8 percent rise in May, and a 0.5 percent increase in April. For the 12 months ended in June, prices for final demand less foods, energy, and trade services rose 5.1 percent, compared to a 5.1 percent increase on an annual basis in May.
Prices for final demand goods contracted by 1.4 percent – following May’s 2.3 percent jump. Goods prices excluding food and energy rose 0.2 percent, speeding up from a 0.7 percent rise in May. Prices for final demand services increased by 0.2 percent in June, after a 0.1 percent decline in May. Final demand transportation and warehousing services fell 0.1 percent following a 2.0 percent rise in May but have soared 13.9 percent compared to June 2025.
Food prices increased 0.5 percent after a 0.6 percent jump in May, and rose 1.8 percent compared to June 2025. Energy prices fell 6.4 percent in June, following May’s 8.4 percent spike, but are 23.0 percent higher compared to June 2025 (after prices jumped 36.6 percent on an annual basis in May). Gasoline prices plunged 12.0 percent on a monthly basis in June but soared 42.9 percent from a year ago.
Market Consensus Before Announcement
Producer prices seen down 0.1 percent on the month on falling energy prices. On year, it’s expected up 6.2 percent.
Definition
The Producer Price Index (PPI) of the Bureau of Labor Statistics (BLS) is a family of indexes that measures the average change over time in the prices received by domestic producers of goods and services. PPIs measure price change from the perspective of the seller. Effective with the January 2014 PPI data release in February 2014, BLS transitioned from the Stage of Processing (SOP) to the Final Demand-Intermediate Demand (FD-ID) aggregation system. The headline PPI (for Final Demand) measures price changes for goods, services, and construction sold to final demand: personal consumption, capital investment, government purchases, and exports.
Description
The PPI measures prices at the producer level before they are passed along to final consumers. A portion of the inflation at the producer level gets passed through to the consumer price index (CPI). By tracking price pressures in the pipeline, investors can anticipate inflationary consequences in coming months.
While the CPI is the price index with the most impact in setting interest rates, the PPI provides significant information earlier in the production process. As a starting point, interest rates have an"inflation premium" and components for risk factors. A lender will want the money paid back from a loan to at least have the same purchasing power as when loaned. The interest rate at a minimum equals the inflation rate to maintain purchasing power and this generally is based on the CPI. Changes in inflation lead to changes in interest rates and, in turn, in equity prices.
The PPI comes in two key main versions: final demand (FD) and intermediate demand (ID). The final demand portion is composed of six main price indexes: final demand goods; final demand trade services; final demand transportation and warehousing services; final demand services less trade, transportation, and warehousing; final demand construction; and overall final demand.
The intermediate demand portion of the FD-ID system tracks price changes for goods, services, and construction products sold to businesses as inputs to production, excluding capital investment. There are two parallel treatments of intermediate demand, each constructed from the identical set of commodity price indexes. The first treatment organizes commodities according to commodity type, and the second organizes commodities using a stage-based, production flow model.
The PPI is considered a precursor of both consumer price inflation and profits. If the prices paid to producers increase, businesses are faced with either charging higher prices or taking a cut in profits. The ability to pass along price increases depends on the strength and competitiveness of the marketplace.
Under the prior PPI system, the producer price index was substantially more volatile than the consumer price index because the CPI included services while the PPI did not. Volatility has been reduced substantially in the PPI-FD due to the inclusion of services but the PPI still is more volatile than the CPI. Wages are a bigger share of the costs at the retail level than at the producer level and this plays a role in the CPI’s lower volatility. Also, the PPI does not include owners’ equivalent rent—a large and slow moving component in the CPI. Food and energy prices are major sources of volatility in the PPI, hence, the greater focus on the"core PPI" which excludes these two components.
The bond market rallies when the PPI decreases or posts only small increases, but bond prices fall when the PPI posts larger-than-expected gains. The equity market rallies with the bond market because low inflation promises low interest rates and is good for profits.