https://www.cmegroup.com/content/dam/cmegroup/images/common/default/article-940x600.jpg

US: Personal Income and Outlays
| Consensus | Consensus Range | Actual | Previous | Revised | |
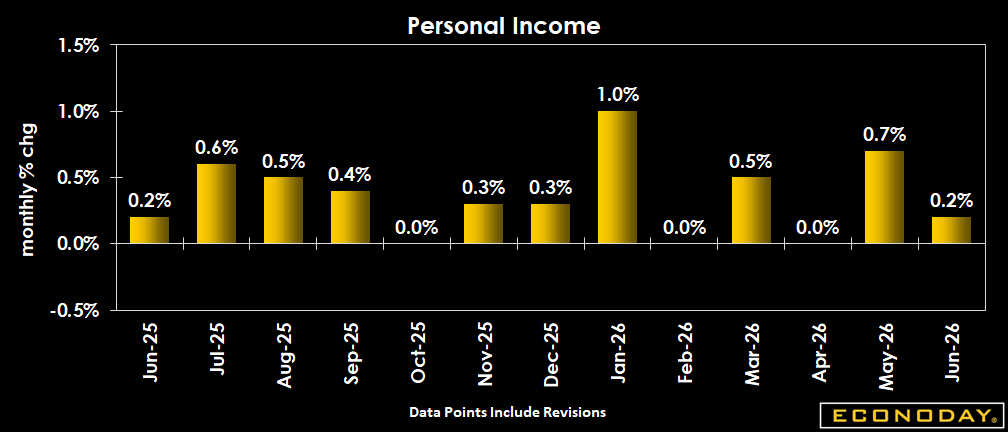
| Personal Income - M/M | 0.3% | 0.0% to 0.5% | 0.2% | 0.7% | |
| Personal Consumption Expenditures - M/M | 0.4% | 0.1% to 0.6% | 0.3% | 0.7% | 0.9% |
| PCE Price Index - M/M | -0.1% | -0.2% to 0.0% | -0.1% | 0.4% | 0.5% |
| PCE Price Index - Y/Y | 3.7% | 3.3% to 3.7% | 3.7% | 4.1% | |
| Core PCE Price Index - M/M | 0.2% | 0.0% to 0.3% | 0.1% | 0.3% | |
| Core PCE Price Index - Y/Y | 3.3% | 3.1% to 3.5% | 3.3% | 3.4% |
Highlights
The brief pause in the Iran conflict, and the resulting decline in energy prices, is apparent in the June Personal Income report, with the monthly inflation rate contracting and the core rate barely rising. The pace of annual core PCE price inflation also slowed down, but not enough to assuage the concerns of Federal Reserve officials. That, along with the decent rate of consumer spending (up 0.4 percent when adjusted for inflation), underscores the FOMC’s increased hawkish posture.
U.S. personal income was up 0.2 percent in June, falling off May’s +0.7 percent pace and below expectations for a 0.3 percent rise in the Econoday survey of forecasters. Consumer spending, as measured by the Personal Consumption Expenditures (PCE) index, slowed to a 0.3 percent increase in June, following a 0.9 percent jump reported for May.
As for the Federal Reserve’s preferred inflation gauge, the PCE price index dipped 0.1 percent on a monthly basis in June, slowing down from a 0.5 percent rise in May. Compared to a year ago, however, the June PCE price index is up 3.7 percent, a slight deceleration from the 4.1 percent year-over-year rise in May.
Prices for goods contracted by 0.6 percent after a 0.4 percent increase in May, and prices for services increased 0.1 percent, following a 0.5 percent rise in the prior month. Food prices were up 0.3 percent, and energy prices plunged 9.2 percent.
Excluding food and energy, the PCE price index was up 0.1 percent, following a 0.3 percent rise in May. The core PCE price index is up 3.3 percent from June 2025, up from +3.4 percent in May. Expectations in the Econoday survey were for a 0.2 percent monthly increase and a 3.3 percent rise on an annual basis.
Market Consensus Before Announcement
Core PCE prices seen up 0.2 percent on the month while overall PCE prices down 0.1 percent as oil product prices fell back in June.
Definition
Personal income represents the income that households receive from all sources including wages and salaries, fringe benefits such as employer contributions to private pension plans, proprietors' income, income from rent, dividends and interest and transfer payments such as Social Security and unemployment compensation. Personal contributions for social insurance are subtracted from personal income.
Personal consumption expenditures are the major portion of personal outlays, which also include personal interest payments and transfer payments. Personal consumption expenditures are divided into durable goods, nondurable goods and services. These figures are the monthly analogues to the quarterly consumption expenditures in the GDP report, available in nominal and real (inflation-adjusted) dollars. Economic performance is more appropriately measured after the effects of inflation are removed.
Each month, the Bureau of Economic Analysis also compiles the personal consumption expenditure price index, also known as the PCE price index. This inflation index measures a basket of goods and services that is updated annually in contrast to the CPI, which measures a fixed basket.
Description
The income and outlays data are another handy way to gauge the strength of the consumer sector in this economy and where it is headed. Income gives households the power to spend and/or save. Spending greases the wheels of the economy and keeps it growing. Savings are often invested in the financial markets and can drive up the prices of stocks and bonds. Even if savings simply go into a bank account, part of those funds typically is used by the bank for lending and therefore contributes to economic activity. In the past twenty years, the personal saving rate has diminished rapidly as consumers have spent a greater and greater share of their income. But that has reversed in part during the recession that began in 2008 as consumers have cut back on credit card use and have been rebuilding retirement accounts.
The consumption (outlays) part of this report is even more directly tied to the economy, which we know usually dictates how the markets perform. Consumer spending accounts for more than two-thirds of the economy, so if you know what consumers are up to, you'll have a pretty good handle on where the economy is headed. Investors can see how consumers are directing their spending, whether they are buying durable goods, nondurable goods or services. Needless to say, that's a big advantage for investors who determine which companies' shares they will buy.
The PCE price indexes have gained importance since the Fed announced a medium-term inflation goal of 2 percent based on the headline number on a year-on-year basis. The Fed forecasts inflation for both the headline PCE price index and the core rate (excluding food and energy).
Importance
Income is the major determinant of spending -- U.S. consumers spend roughly 95 cents of each new dollar. Consumer spending accounts directly for more than two-thirds of overall economic activity and indirectly influences capital spending, inventory investment and imports.
Interpretation
Increases (decreases) in income and consumption cause bond prices to fall (rally). As long as spending isn't inflationary, the stock market benefits because greater spending spurs corporate profits. Financial market participants pay somewhat less attention to personal consumption expenditures than to retail sales, which are released earlier in the month. However, they do closely monitor personal income and the PCE deflator.
Changes in personal income signal changes in consumer spending. For instance, a period of rapid income growth may signal future gains in personal consumption expenditures as well. Conversely, a period of declining income growth could signal an impending recession. While consumers often still must purchase necessities, discretionary purchases may decline, or moderate.
Consumers are more likely to increase spending when they see their stock portfolios increase in tandem with the stock market. When the stock market falls, spending is likely to decline because consumers feel less wealthy. Home prices and home equity have similar effects. Rising home prices boost the amount of equity consumers have in their homes. This allows access to Home Equity Line of Credit (HELOC) accounts. Plus consumers feel wealthier whether they have a HELOC account or not. When home prices decline, home equity falls and cuts into consumer spending.
Personal income is a comprehensive figure, but also incorporates taxes consumers must pay. By removing personal tax payments from personal income, we are left with disposable income. This is what consumers have left to spend on goods and services. Adjusting for inflation reveals growth in real disposable income.
On the inflation front, if PCE inflation is running below the Fed's goal of 2 percent inflation, that is seen as favorable toward Fed ease or neutral monetary policy. PCE inflation above 2 percent suggests that the Fed might be more inclined to raise policy rates.