| Consensus | Consensus Range | Actual | Previous | Revised | |
| Annual Rate | 662K | 645K to 690K | 622K | 682K | 663K |
Highlights
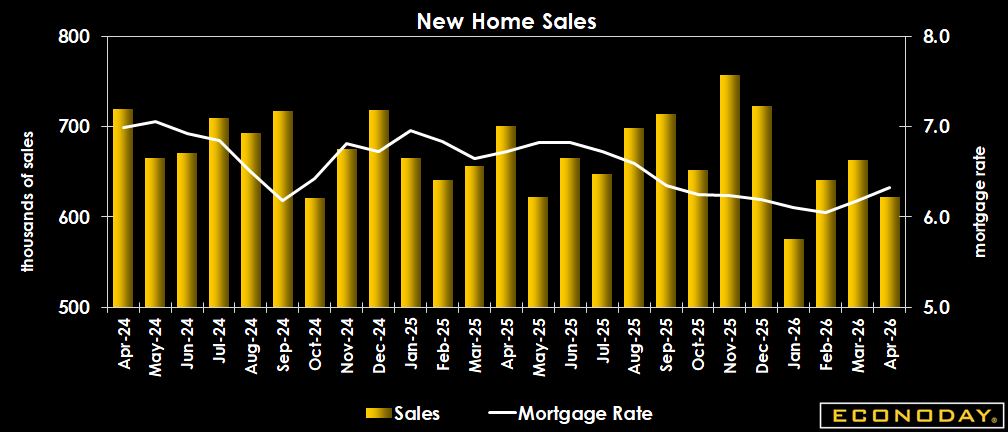
U.S. new home sales slowed down in April, coming in below expectations, following a downward revision to March's already tepid reading. The months' supply of new homes for sale did rise by 1.7 percent from March but is down 2.2 percent compared to April 2025. Weak new home sales in the Northeast region (-12.9 percent) dragged down last month's rate, with negative contributions also from the South (-9.8 percent) and Midwest (-25.0 percent) regions.
Sales of new single-family houses in April are estimated at a 622,000 annual rate, falling off the pace from the revised 663,000 reported for March (previously 682,000), and below the 662,000 expected in the Econoday survey of forecasters.
April's new home sales rate is 6.2 percent weaker than March, and 11.3 percent below the April 2025 rate of 701,000.
The median sales price of new houses sold in April was $422,500 compared to $391,100 in March, and $413,600 in April 2025. The average sales price was $508,800.
The inventory of new houses for sale rose slightly from 481,000 at the end of March to 489,000 at the end of April. The months' supply was 9.4 months in April, compared to 8.7 months in March at the current sales rate. Inventory was at 8.6 months of supply in April 2025.
Market Consensus Before Announcement
Sales seen at an annual 662K rate in April, down from an already sluggish 682K in March.
* Originally scheduled for 5/27/2026
Definition
New home sales measure the number of newly constructed homes with a committed sale during the month. The level of new home sales indicates housing market trends and, in turn, economic momentum and consumer purchases of furniture and appliances.
Description
This provides a gauge of not only the demand for housing, but the economic momentum. People have to be feeling pretty comfortable and confident in their own financial position to buy a house. Furthermore, this narrow piece of data has a powerful multiplier effect through the economy, and therefore across the markets and your investments. By tracking economic data such as new home sales, investors can gain specific investment ideas as well as broad guidance for managing a portfolio. Each time the construction of a new home begins, it translates to more construction jobs, and income which will be pumped back into the economy. Once the home is sold, it generates revenues for the home builder and the realtor. It brings a myriad of consumption opportunities for the buyer. Refrigerators, washers, dryers and furniture are just a few items new home buyers might purchase. The economic"ripple effect" can be substantial especially when you think a hundred thousand new households around the country are doing this every month. Since the economic backdrop is the most pervasive influence on financial markets, new home sales have a direct bearing on stocks, bonds and commodities. In a more specific sense, trends in the new home sales data carry valuable clues for the stocks of home builders, mortgage lenders and home furnishings companies.