| Consensus | Consensus Range | Actual | Previous | Revised | |
| Annual Rate | 728K | 710K to 800K | 587K | 745K | 712K |
Highlights
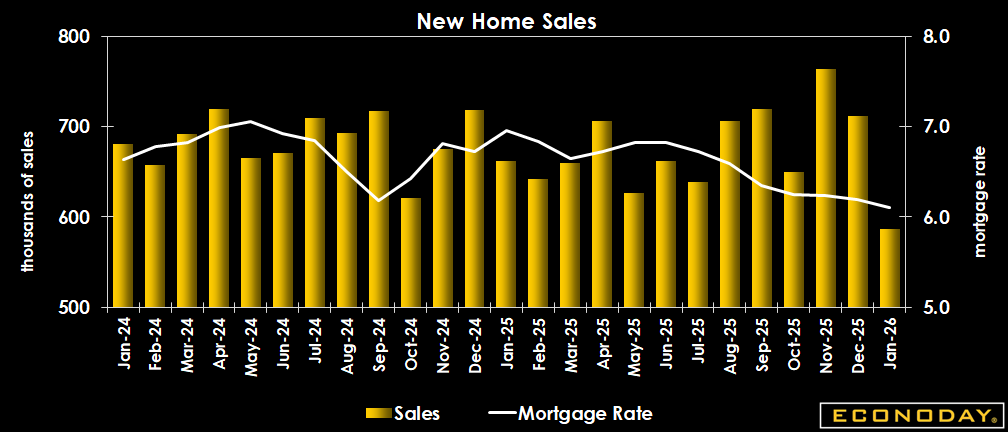
Sales of new single-family homes fall 17.6 percent to a seasonally adjusted annual rate of 587,000 in January. Sales are down 11.3 percent compared to January 2025. The level is substantially below the consensus of 728,000 in the Econoday survey of forecasters. Severe winter weather across much of the US probably contributed to the steep decline despite the decline in mortgage rates to their lowest in over three years.
The Freddie Mac average monthly rate for a 30-year fixed rate mortgage is 6.11 percent for January, down from 6.19 percent in December and the lowest since 6.11 percent in September 2022.
Sales are down in all regions in January. Sales in the Northeast fell 44.7 percent, the Midwest 33.9 percent, the South 8.1 percent, and the West 21.6 percent. Milder weather in February and continued favorable mortgage rates could boost sales in February.
The share of homes being sold shows that buyers are favoring units already under construction or completed. The share of homes sold but not yet started is 9 percent of the total, while 33 percent of sales are for units under construction, and 59 percent of sales are for units completed.
The median price of a new single-family home is down 4.5 percent in January to $400,500 from $419,200 in December, and down 6.8 percent from $429,600 in January 2025. The market for new homes is less competitive and homebuilders are shifting to smaller, more affordable units as better accessible to buyers in the current market.
Market Consensus Before Announcement
Already soft sales seen weaker at an annual 728K in January versus 745K in December.
* Originally scheduled for 2/25/2026
Definition
New home sales measure the number of newly constructed homes with a committed sale during the month. The level of new home sales indicates housing market trends and, in turn, economic momentum and consumer purchases of furniture and appliances.
Description
This provides a gauge of not only the demand for housing, but the economic momentum. People have to be feeling pretty comfortable and confident in their own financial position to buy a house. Furthermore, this narrow piece of data has a powerful multiplier effect through the economy, and therefore across the markets and your investments. By tracking economic data such as new home sales, investors can gain specific investment ideas as well as broad guidance for managing a portfolio. Each time the construction of a new home begins, it translates to more construction jobs, and income which will be pumped back into the economy. Once the home is sold, it generates revenues for the home builder and the realtor. It brings a myriad of consumption opportunities for the buyer. Refrigerators, washers, dryers and furniture are just a few items new home buyers might purchase. The economic"ripple effect" can be substantial especially when you think a hundred thousand new households around the country are doing this every month. Since the economic backdrop is the most pervasive influence on financial markets, new home sales have a direct bearing on stocks, bonds and commodities. In a more specific sense, trends in the new home sales data carry valuable clues for the stocks of home builders, mortgage lenders and home furnishings companies.