| Consensus | Consensus Range | Actual | Previous | |
| Index | 53.9 | 53.2 to 55.0 | 53.6 | 54.0 |
Highlights
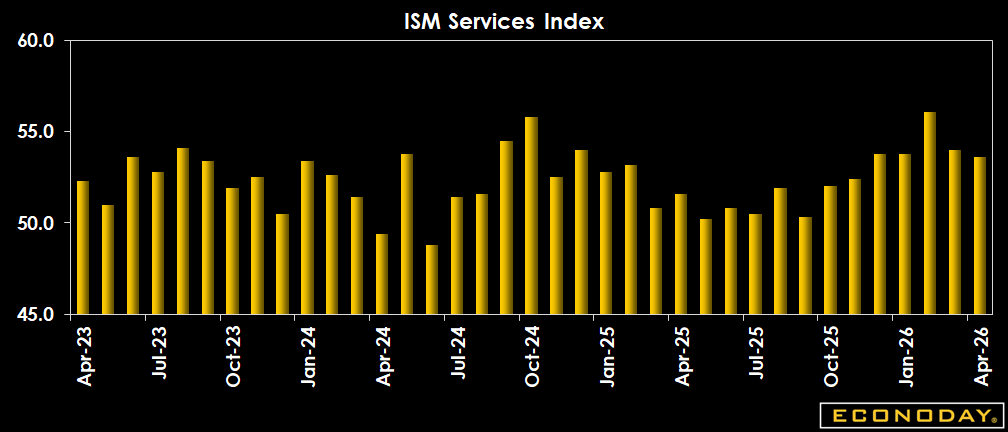
Another month of remarkable stability in services business activity growth with the ISM index at 53.6 in April versus 54.0 in March, very close to the 53.9 Econoday consensus. That follows a similar outcome on the manufacturing side as the ISM manufacturing index came in at 52.7 in April, flat from 52.7 in March.
For ISM services, it's gratifying to see new orders remain in expansion at 53.5 in April, though down from 60.6 in March. That differs from the rival services PMI from S&P released earlier, which showed new orders contracted in April from March.
Employment stays in contraction at 48.0 versus 45.2 in March in the ISM report. Unfortunately, prices paid remains elevated at 70.7, flat from March, as all commodities in the ISM batch are up in price in April. Not surprisingly, commodities most often cited for increases are diesel, gasoline, and oil, reflecting the Mideast conflict. Several survey respondents say they have not yet seen price increases for other items most sensitive to these fuel prices. That suggests additional elevated prices readings ahead no matter whether the conflict ends soon as the current price increases work through the supply chain.
Market Consensus Before Announcement
Similar to the ISM manufacturing report that was unchanged from March to April at 52.7, the services index is seen flat at 53.9 in April versus 54.0 in March.
Definition
Producing a monthly composite on general activity tracked in volumes, the Institute for Supply Management surveys several hundred service-providing firms from 16 industries (construction and mining are included). The services composite index has four equally weighted components: business activity (closely related to a production index), new orders, employment, and supplier deliveries (also known as vendor performance). The first three components are seasonally adjusted but the supplier deliveries index does not have statistically significant seasonality and is not adjusted. For the composite index, a reading above 50 percent indicates that the services economy is generally expanding; below 50 percent indicates that it is generally declining. The supplier deliveries component index requires extra explanation: a reading above 50 percent indicates slower deliveries and below 50 percent indicates faster deliveries.
Description
Investors need to keep their fingers on the pulse of the economy because it dictates how various types of investments will perform. By tracking economic data like the ISM services index, investors will know what the economic backdrop is for the various markets. The services index is a composite of four equally weighted components: business activity, new orders, employment, and supplier deliveries. The stock market likes to see healthy economic growth because that translates to higher corporate profits. The bond market prefers less rapid growth and is extremely sensitive to whether the economy is growing too quickly -- and causing potential inflationary pressures. While the ISM manufacturing index has a long history that dates to the 1940s, this report goes back to 1997. Note that in 2020 the ISM changed the name of the report to services from non-manufacturing though it continues to track two key goods producing industries: construction and mining.