| Consensus | Consensus Range | Actual | Previous | |
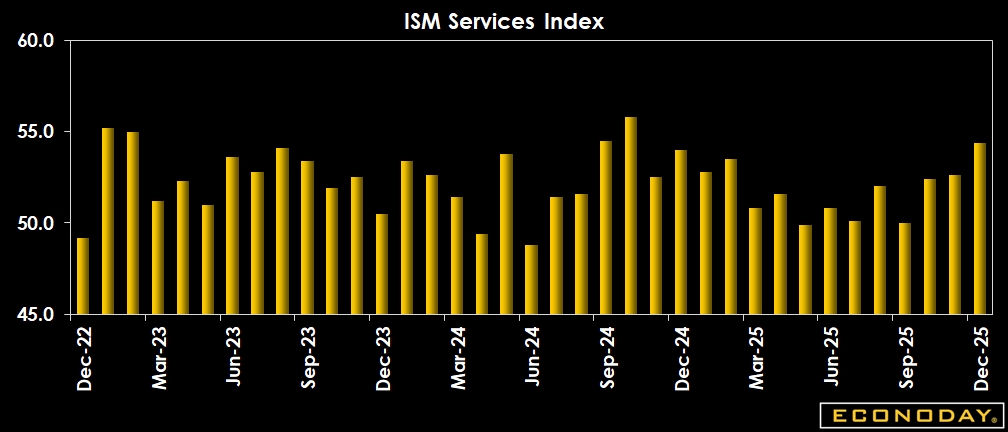
| Index | 52.2 | 51.0 to 52.8 | 54.4 | 52.6 |
Highlights
U.S. services sector activity expanded for the third straight month in December to record its strongest reading of the year. Business activity as well as new orders (a gauge of demand) continued to improve, while employment increased for the first time in seven months. However, the holiday period, as well as year-end activities/prep for 2026 provided the boost, so it remains to be seen how much carries over and is sustained in the New Year.
The ISM Services PMI saw a small improvement to 54.4 in December, up from the 52.6 recorded in November, and better than expectations for 52.2 in the Econoday survey of forecasters.
The December Services PMI reading of 54.4 percent is 2.7 percentage points above the 12-month average of 51.7 percent, the report said. However, the 12-month average continues at its lowest level since August 2024 (51.7 percent) for the third month in a row; it's also the second lowest since June 2010 (51.4 percent).
December's Services PMI is a continuation of a downward trend (as noted in previous reports) of more than 10 percentage points in the 12-month average since February 2022, when it was 62.6 percent, it added.
Tariff impacts and seasonality were common themes among panelists' comments.
The prices paid index, at 64.3, was a noticeable drop from 65.4 in November, but the index has been above 60.0 for 13 consecutive months.
Market Consensus Before Announcement
The consensus sees services index suggesting more slow growth at 52.2 versus 52.6 in November.
Definition
Producing a monthly composite on general activity tracked in volumes, the Institute for Supply Management surveys several hundred service-providing firms from 16 industries (construction and mining are included). The services composite index has four equally weighted components: business activity (closely related to a production index), new orders, employment, and supplier deliveries (also known as vendor performance). The first three components are seasonally adjusted but the supplier deliveries index does not have statistically significant seasonality and is not adjusted. For the composite index, a reading above 50 percent indicates that the services economy is generally expanding; below 50 percent indicates that it is generally declining. The supplier deliveries component index requires extra explanation: a reading above 50 percent indicates slower deliveries and below 50 percent indicates faster deliveries.
Description
Investors need to keep their fingers on the pulse of the economy because it dictates how various types of investments will perform. By tracking economic data like the ISM services index, investors will know what the economic backdrop is for the various markets. The services index is a composite of four equally weighted components: business activity, new orders, employment, and supplier deliveries. The stock market likes to see healthy economic growth because that translates to higher corporate profits. The bond market prefers less rapid growth and is extremely sensitive to whether the economy is growing too quickly -- and causing potential inflationary pressures. While the ISM manufacturing index has a long history that dates to the 1940s, this report goes back to 1997. Note that in 2020 the ISM changed the name of the report to services from non-manufacturing though it continues to track two key goods producing industries: construction and mining.