https://www.cmegroup.com/content/dam/cmegroup/images/common/default/article-940x600.jpg

US: Import and Export Prices
| Consensus | Consensus Range | Actual | Previous | Revised | |
| Import Prices - M/M | 0.1% | -0.1% to 0.4% | -0.4% | 0.3% | -0.3% |
| Import Prices - Y/Y | 5.9% | 7.1% | |||
| Export Prices - M/M | 0.0% | -0.2% to 0.2% | -1.3% | -0.6% | -0.7% |
| Export Prices - Y/Y | 8.2% | 10.2% |
Highlights
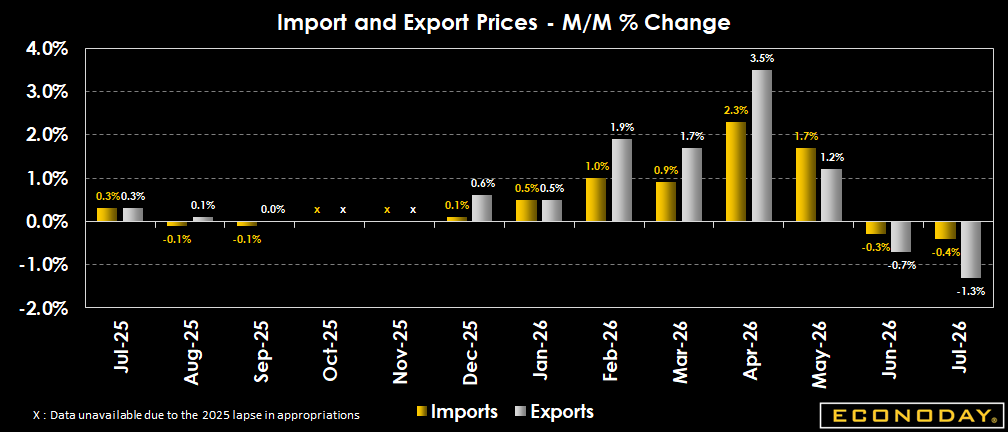
U.S. import prices are down 0.4 percent in July from June after a revised 0.3 percent decrease in June. A 7.2 percent drop in prices for fuel imports more than offset a 0.4 percent rise in prices for nonfuel imports in July.
On the export side, prices decrease 1.3 percent in July after falling a revised 0.7 percent on the month in June. A 1.5 percent drop in prices of nonagricultural exports more than offset a 1.0 percent increases in prices for agricultural exports.
Market Consensus Before Announcement
Import and export prices are expected basically flat in July from June.
Definition
Import price indexes are compiled for the prices of goods that are bought in the United States but produced abroad and export price indexes are compiled for the prices of goods sold abroad but produced domestically. These prices, which exclude tariffs and taxes, measure underlying inflationary trends in internationally traded products.
Description
Changes in import and export prices are a valuable gauge of inflation here and abroad. Furthermore, the data can directly impact the financial markets such as bonds and the dollar. The bond market is especially sensitive to the risk of importing inflation because it erodes the value of the principal (the original investment) which is paid back when the bond matures. It also decreases the value of the steady stream of interest rate payments on this type of security. Inflation leads to higher interest rates and that's bad news for stocks, as well. By monitoring inflation gauges such as import prices, investors can keep an eye on this menace to their portfolios.