https://www.cmegroup.com/content/dam/cmegroup/images/common/default/article-940x600.jpg

US: Housing Starts and Permits
| Consensus | Consensus Range | Actual | Previous | Revised | |
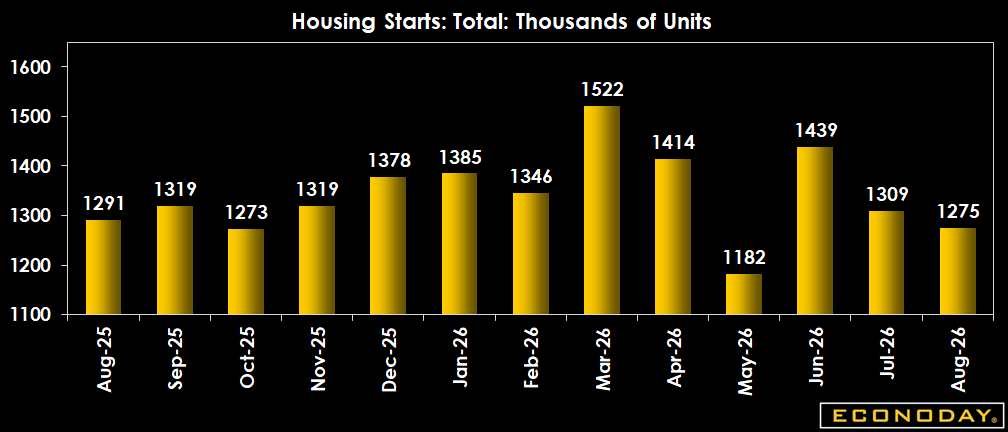
| Starts - Annual Rate | 1.315M | 1.250M to 1.363M | 1.275M | 1.239M | 1.309M |
| Permits - Annual Rate | 1.400M | 1.350M to 1.425M | 1.394M | 1.443M | 1.433M |
Highlights
The pace of U.S. housing starts fell unexpectedly in August, dragged down by a decline in multi-family housing starts. The outlook is gloomy for future construction activity, with a decline in permit applications to build both single- and multi-family homes.
August housing starts came in at a seasonally adjusted annual rate of 1,275,000, 2.6 percent below July’s estimate of 1,309,000 (revised up from 1,239,000). Expectations in the Econoday survey of forecasters was an August annual rate of 1.315 million.
New residential construction is also 3.5 percent above the August 2025 rate of 1,347,000.
The rebound in building permit applications in July fed through to August’s single-family housing starts, coming in at a rate of 918,000, a 7.6 percent rise from July’s rate of 853,000. The August rate for multi-family housing units was 344,000, compared to 444,000 in July.
The outlook for future activity remains downbeat. U.S. building permits in August were at a seasonally adjusted annual rate of 1,394,000. This is 2.7 percent lower than the July rate of 1,433,000 (revised from 1,443,000) but 3.5 percent above the August 2025 rate of 1,347,000.
Permits to build single-family homes in August were at a rate of 878,000, down 1.8 percent from the July figure of 894,000. Permits to construct buildings with five units or more were at a rate of 467,000 compared to 482,000 in July.
Market Consensus Before Announcement
Starts expected a bit better at 1.315 million unit rate in August from 1.239 million in July with a boost from multifamily construction while single family starts are limited by affordability issues. Permits seen down at 1.400 million rate from 1.443 in July.
Definition
Housing starts measure the initial construction of single-family and multi-family units on a monthly basis. Data on permits provide indications of future construction.
Description
Two words: Ripple Effect. This narrow piece of data has a powerful multiplier effect through the economy, and therefore across the markets and your investments. By tracking economic data such as housing starts, investors can gain specific investment ideas as well as broad guidance for managing a portfolio.
Home builders usually don't start a house unless they are fairly confident it will sell upon or before its completion. Changes in the rate of housing starts tell us a lot about demand for homes and the outlook for the construction industry. Furthermore, each time a new home is started, construction employment rises, and income will be pumped back into the economy. Once the home is sold, it generates revenues for the home builder and a myriad of consumption opportunities for the buyer. Refrigerators, washers and dryers, furniture, and landscaping are just a few things new home buyers might spend money on, so the economic"ripple effect" can be substantial especially when you think of it in terms of more than a hundred thousand new households around the country doing this every month.
Since the economic backdrop is the most pervasive influence on financial markets, housing starts have a direct bearing on stocks, bonds and commodities. In a more specific sense, trends in the housing starts data carry valuable clues for the stocks of home builders, mortgage lenders, and home furnishings companies. Commodity prices such as lumber are also very sensitive to housing industry trends.
Importance
The housing starts report is the most closely followed report on the housing sector. Housing starts reflect the commitment of builders to new construction activity. Purchases of household furnishings and appliances quickly follow.
Interpretation
The bond market will rally when housing starts decrease, but bond prices will fall when housing starts post healthy gains. A strong housing market is bullish for the stock market because the ripple effect of housing to consumer durable purchases spurs corporate profits. In turn, low interest rates encourage housing construction.
The level as well as changes in housing starts reveals residential construction trends. Housing starts are subject to substantial monthly volatility, especially during winter months. It takes several months to establish a trend. Thus, it is useful to look at a 5-month moving average (centered) of housing starts.
It is useful to examine the trends in construction activity for single homes and multi-family units separately because they can deviate significantly. Single-family home-building is larger and less volatile than multi-family construction. It is more sensitive to interest rate changes and less speculative in nature. The construction of multi-family units can be substantially influenced by changes in the tax code and speculative real estate investors.
Housing construction varies by region as well. The regions of the United States do not all follow exactly the same economic patterns because industry concentration varies in the four major regions of the country. The regional dispersion can mask underlying trends. The total level of housing construction as well as the regional distribution of housing construction is important.
Housing permits are released together with housing starts every month and are considered a leading indicator of starts. In reality, housing permits and starts typically move in tandem each month. However, there are some exceptions. For instance, if permits are issued late in the month, and weather does not permit immediate excavation, then permits might lead starts. For the most part, though, permits are not a good predictor of future housing starts. Incidentally, housing permits (but not starts) are one of the ten components of the index of leading indicators compiled by The Conference Board.