| Consensus | Consensus Range | Actual | Previous | |
| Quarter over Quarter - Annual Rate | 1.5% | 1.4% to 1.6% | 1.5% | 1.5% |
| Personal Consumption Expenditures - Annual Rate | 3.2% | 2.8% to 3.2% | 3.4% | 3.2% |
Highlights
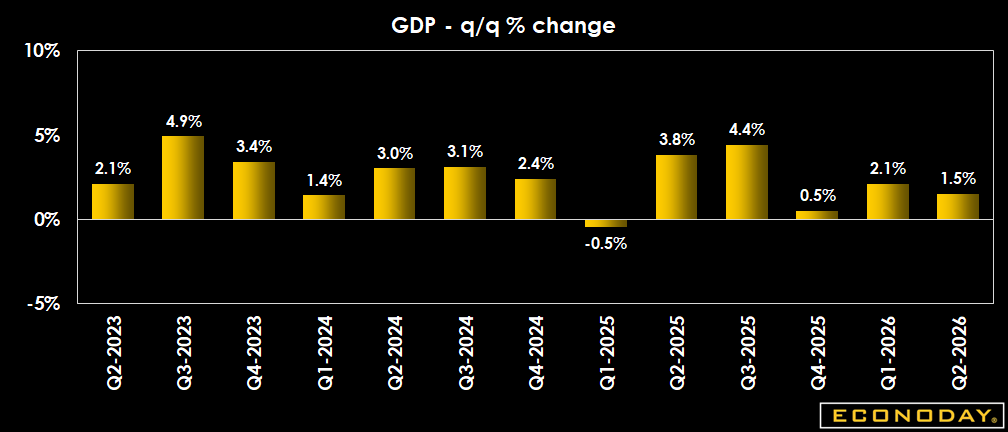
The revised estimate of the U.S. Q2 GDP showed no change in the growth rate of economic activity (as analysts had expected), lagging the pace set in Q1. Upward adjustments to the rate of consumer spending as well as imports affected the headline GDP number.
However, the spike in PCE price inflation – shooting above 5 percent for the quarter and with the monthly report showing the July core PCE price index up 3.3 percent compared to a year ago – increases the pressure on the Federal Reserve heading into the September FOMC meeting.
The second estimate for Q2 GDP shows it increased by 1.5 percent, the same pace as reported in the advance estimate, slowing down from the 2.1 percent rise in the first quarter of 2026. The revised estimate meets expectations for a 1.5 percent rise in the Econoday survey of forecasters.
Consumer spending as measured by Personal Consumption Expenditures rose 3.4 percent in Q2 – an upward revision from the 3.2 percent initially reported, and accelerating from the 0.5 percent rise in the first quarter. Imports surged by 12.5 percent after Q1’s 11.8 percent spike. Goods imports jumped 15.9 percent in Q2, following a 1.6.6 percent increase in Q1.
Exports grew at a slower rate in the second quarter – part of the reason for the slower pace of economic growth. They increased 4.5 percent, after soaring 10.9 percent in the first quarter.
Gross domestic private investment eased to a 2.7 percent growth rate – failing to build on Q1’s 7.9 percent rise. Non-residential fixed investment, a proxy for business capex spending, jumped 8.5 percent in Q1 – down from Q1’s 10.6 percent rate.
Government expenditures contracted by 1.0 percent, not enough to erase Q1’s 4.4 percent rise. Non-defense spending plunged, shrinking 13.2 percent following a 20.7 percent jump in Q1.
The PCE price index increased 5.3 percent, up from +4.6 percent in Q1. Core PCE price index increased 3.6 percent, slowing down from +4.4 percent in Q1.
Market Consensus Before Announcement
The consensus look for no revision for GDP at 1.5 percent growth for Q2.
Definition
Gross Domestic Product represents the total value of the country's production during the period and consists of the purchases of domestically-produced goods and services by individuals, businesses, foreigners and government entities. Data are available in nominal and real (inflation-adjusted) dollars, as well as in index form. Economists and market players always monitor the real growth rates generated by the GDP quantity index or the real dollar value. The quantity index measures inflation-adjusted activity, but we are more accustomed to looking at dollar values.
Household purchases are counted in personal consumption expenditures -- durable goods (such as furniture and cars), nondurable goods (such as clothing and food) and services (such as banking, education and transportation). Private housing purchases are classified as residential investment. Businesses invest in nonresidential structures, durable equipment and computer software. Inventories at all stages of production are counted as investment. Only inventory changes, not levels, are added to GDP.
Net exports equal the sum of exports less imports. Exports are the purchases by foreigners of goods and services produced in the United States. Imports represent domestic purchases of foreign-produced goods and services and must be deducted from the calculation of GDP. Government purchases of goods and services are the compensation of government employees and purchases from businesses and abroad. Data show the portion attributed to consumption and investment. Government outlays for transfer payments or interest payments are not included in GDP.
The GDP price index is a comprehensive indicator of inflation. It is typically lower than the consumer price index because investment goods (which are in the GDP price index but not the CPI) tend to have lower rates of inflation than consumer goods and services. Note that contributions of each component, as averaged over the prior year, are tracked in the table below (components do not exactly sum to total due to chain-weighted methodology). Consumption expenditures, otherwise known as consumer spending, has over history been steadily making up an increasing share of GDP.
Description
GDP is the all-inclusive measure of economic activity. Investors need to closely track the economy because it usually dictates how investments will perform. Investors in the stock market like to see healthy economic growth because robust business activity translates to higher corporate profits. Bond investors are more highly sensitive to inflation and robust economic activity could potentially pave the road to inflation. By tracking economic data such as GDP, investors will know what the economic backdrop is for these markets and their portfolios.
The GDP report contains a treasure-trove of information which not only paints an image of the overall economy, but tells investors about important trends within the big picture. GDP components such as consumer spending, business and residential investment, and price (inflation) indexes illuminate the economy's undercurrents, which can translate to investment opportunities and guidance in managing a portfolio.
Importance
Gross domestic product is the country's most comprehensive economic scorecard.
Interpretation
When gross domestic product expands more (less) rapidly that its potential, bond prices fall (rise). Healthy GDP growth usually translates into strong corporate earnings, which bode well for the stock market.
The four major categories of GDP -- personal consumption expenditures, investment, net exports and government -- all reveal important information about the economy and should be monitored separately. One can thus determine the strengths and weaknesses of the economy in order to assess alternatives and make appropriate financial investment decisions.
Economists and financial market participants monitor final sales -- GDP less the change in business inventories. When final sales are growing faster than inventories, this points to increases in production in months ahead. Conversely, when final sales are growing more slowly than inventories, they signal a slowdown in production.
It is useful to distinguish between private demand versus growth in government expenditures. Market players discount growth in the government sector because it depends on fiscal policy rather than economic conditions.
Market participants view increased expenditures on investment favorably because they expand the productive capacity of the country. This means that we can produce more without inciting inflationary pressures.
Net exports are a drag on total GDP because the United States regularly imports more than it exports, that is, net exports are in deficit. When the net export deficit becomes less negative, it adds to growth because a smaller amount is subtracted from GDP. When the deficit widens, it subtracts even more from GDP.
Gross domestic product is subject to some quarterly volatility, so it is appropriate to follow year-over-year percent changes, to smooth out this variation.