https://www.cmegroup.com/content/dam/cmegroup/images/common/default/article-940x600.jpg

US: Employment Situation
| Consensus | Consensus Range | Actual | Previous | Revised | |
| Nonfarm Payrolls - M/M | 55,000 | 12,000 to 100,000 | 162,000 | -23,000 | 21,000 |
| Unemployment Rate | 4.2% | 4.0% to 4.2% | 4.1% | 4.1% | |
| Private Payrolls - M/M | 53,000 | 30,000 to 72,000 | 127,000 | 30,000 | 71,000 |
| Manufacturing Payrolls - M/M | 5,000 | 5,000 to 7,000 | 16,000 | 5,000 | 14,000 |
| Participation Rate | 61.6% | 61.4% | |||
| Average Hourly Earnings - M/M | 0.3% | 0.2% to 0.3% | 0.3% | 0.1% | |
| Average Hourly Earnings - Y/Y | 3.0% | 3.0% to 3.3% | 3.1% | 3.2% | |
| Average Workweek | 34.3hrs | 34.3hrs to 34.3hrs | 34.4hrs | 34.3hrs |
Highlights
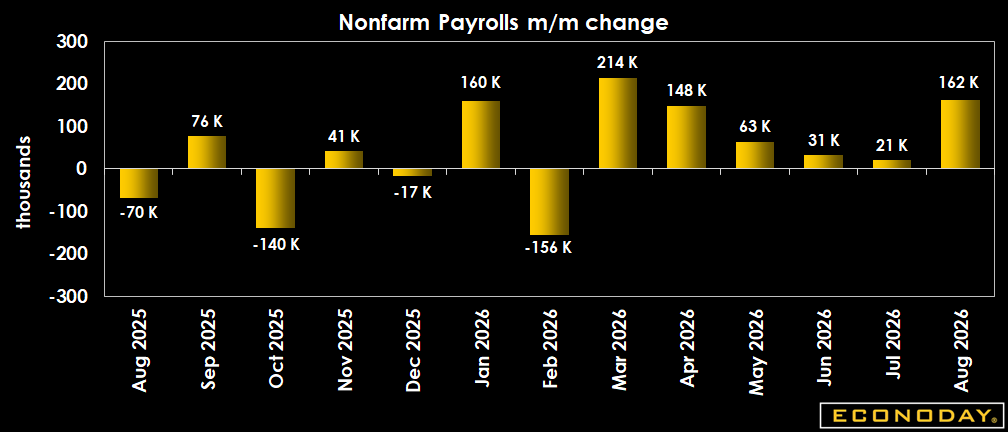
Blowout gain in jobs in August alters the picture on the economy and puts a rate hike from the Federal Reserve this month back in play.
Nonfarm jobs up a whopping 162,000 in August versus the moderate 55,000 expected, with private payrolls rising 127,000. Adding to the upside surprise are upward revisions for prior months including July, now up 21,000 versus the decrease of 23,000 previously reported.
A rise of 162,000 might have seemed routine a few years ago when the labor force was rising with big immigration but lately the monthly figure has been trending around the 55,000 that we didn't get today, which makes this massive and surprising.
The change in total nonfarm payroll employment for June is revised up by 11,000, from +20,000 to +31,000, and the change for July was revised up by 44,000, from -23,000 to +21,000. With these revisions, employment in June and July combined is 55,000 higher than previously reported.
The jobless rate is unchanged at 4.1 percent versus the uptick to 4.2 percent expected. Hourly earnings rise 0.3 percent, as expected. Earnings are up 3.1 percent from a year ago.
The labor force participation rate firms to 61.6 percent in August from 61.4 percent in July. It is still down by 0.5 percentage point since January. The employment-population ratio, at 59.1 percent, changed
little over the month and since January.
The average workweek for all employees on private nonfarm payrolls rises by 0.1 hour to 34.4 hours in August. In manufacturing, the average workweek edges up by 0.1 hour to 40.5 hours, and overtime was unchanged at 3.1 hours. The average workweek for production and nonsupervisory employees on private nonfarm payrolls is flat at 33.8 hours.
Back to August payrolls: here are details from BLS:
Employment in food services and drinking places rises by 59,000 in August, well above the average monthly gain of 12,000 over the prior 12 months.
Local government education gains 42,000 jobs in August, largely offsetting a decrease in the prior month. Local government education has shown little net change since January 2025.
Manufacturing continued its upward trend (+16,000) and is up by
58,000 since a recent low in December 2025. Employment in machinery manufacturing (+6,000) and in fabricated metal product manufacturing (+6,000) continued trending up in August.
Employment in health care continues its rising trend in August (+13,000) but at a slower pace than the average monthly gain over the prior 12 months (+32,000). Over the month, home health care services (+11,000) and hospitals (+8,000) add jobs.
Information employment falls by 23,000 in August, following losses that had averaged 8,000 per month over the prior 12 months. In August, job losses occurred in computing infrastructure providers, data processing, web hosting, and related services (-8,000), in publishing industries (-7,000), and in broadcasting and content providers (-5,000).
Construction employment is up in August (+22,000). Employment in nonresidential specialty trade contractors continued to trend up (+8,000), similar to the average monthly gain over the prior 12 months (+6,000).
Market Consensus Before Announcement
Payrolls seen up a moderate 55K after a surprising 23K decline in July. The jobless rate is expected up at 4.2 percent from 4.1 percent in July.
Definition
The most closely watched of all economic indicators, the employment situation is a set of monthly labor market indicators based on two separate reports: the establishment survey which tracks 650,000 worksites and offers the nonfarm payroll and average hourly earnings headlines and the household survey which interviews 60,000 households and generates the unemployment rate.
Nonfarm payrolls track the number of part-time and full-time employees in both business and government. Average hourly earnings track employee pay while the average workweek, also part of the establishment survey, tracks the number of hours worked. The report's private payroll measure excludes government workers.
The unemployment rate measures the number of unemployed as a percentage of the labor force. In order to be counted as unemployed, one must be actively looking for work. Other commonly known data from the household survey include the labor supply and discouraged workers.
Description
If ever there was an economic report that can move the markets, this is it! The anticipation on Wall Street each month is palpable, the reactions can be dramatic, and the information for investors is invaluable. By digging just a little deeper than the headline unemployment rate, investors can take more strategic control of their portfolio and even take advantage of unique investment opportunities that often arise in the days surrounding this report.
The employment data give the most comprehensive report on how many people are looking for jobs, how many have them, what they're getting paid and how many hours they are working. These numbers are the best way to gauge the current state as well as the future direction of the economy. Nonfarm payrolls are categorized by sectors. This sector data can go a long way in helping investors determine in which economic sectors they intend to invest.
The employment statistics also provide insight on wage trends, and wage inflation is high on the list of opponents of easy monetary policy. Fed officials constantly monitor this data watching for even the smallest signs of potential inflationary pressures, even when economic conditions are soggy. If inflation is under control, it is easier for the Fed to maintain a more accommodative monetary policy. If inflation is a problem, the Fed is limited in providing economic stimulus.
By tracking the jobs data, investors can sense the degree of tightness in the job market. If wage inflation threatens, it's a good bet that interest rates will rise; bond and stock prices will fall. No doubt that the only investors in a good mood will be the ones who watched the employment report and adjusted their portfolios to anticipate these events. In contrast, when job growth is slow or negative, then interest rates are likely to decline - boosting up bond and stock prices in the process.
Importance
The employment situation is the primary monthly indicator of aggregate economic activity because it encompasses all major sectors of the economy. It is comprehensive and available early in the month. Many other economic indicators are dependent upon its information. It not only reveals information about the labor market, but about income and production as well. In short, it provides clues about other economic indicators reported for the month and plays a big role in influencing financial market psychology during the month. Additionally, the Fed has made 6.5 percent unemployment a threshold for considering changes in policy - both for quantitative easing and the fed funds rate. And the Fed has emphasized that it is overall labor market conditions that matter - not just a specific number.
Interpretation
The bond market will rally (fall) when the employment situation shows weakness (strength). The equity market often rallies with the bond market on weak data because low interest rates are good for stocks. But sometimes the two markets move in opposite directions. After all, a healthy labor market should be favorable for the stock market because it supports economic growth and corporate profits. At the same time, bond traders are more concerned about the potential for inflationary pressures.
The unemployment rate rises during cyclical downturns and falls during periods of rapid economic growth. A rising unemployment rate is associated with a weak or contracting economy and declining interest rates. Conversely, a decreasing unemployment rate is associated with an expanding economy and potentially rising interest rates. The fear is that wages will accelerate if the unemployment rate becomes too low and workers are hard to find.
Nonfarm payroll employment indicates the current level of economic activity. Increases in nonfarm payrolls translate into earnings that workers will spend on goods and services in the economy. The greater the increase in employment, the faster is the total economic growth. When the economy is in the mature phase of an expansion, rapid increases in employment cause fears of inflationary pressures if rapid demand for goods and services cannot be met by current production.
When the average workweek trends up, it supports production gains in the current period and portends additional employment increases. When the average workweek is in a declining mode, it probably is signaling a potential slowdown in employment growth-or even outright declines in employment in case of recession.
Gains in average hourly earnings represent wage pressures. It is worth noting that these figures aren't adjusted for overtime pay or shifts in the composition of the workforce, which affects wages on its own. Market participants believe that a rising trend in hourly earnings will lead to higher inflation. But if increased wages are matched by productivity gains, producers likely will not increase product prices with wages because their unit labor costs are stable.