https://www.cmegroup.com/content/dam/cmegroup/images/common/default/article-940x600.jpg
US: Durable Goods Orders
| Consensus | Consensus Range | Actual | Previous | Revised | |
| New Orders - M/M | -2.3% | -5.1% to 1.0% | -1.4% | 5.3% | 5.4% |
| Ex-Transportation - M/M | 0.3% | 0.2% to 0.4% | 0.9% | 0.5% | 0.4% |
| Core Capital Goods - M/M | 0.2% | 0.1% to 0.2% | 0.6% | 0.7% | 0.8% |
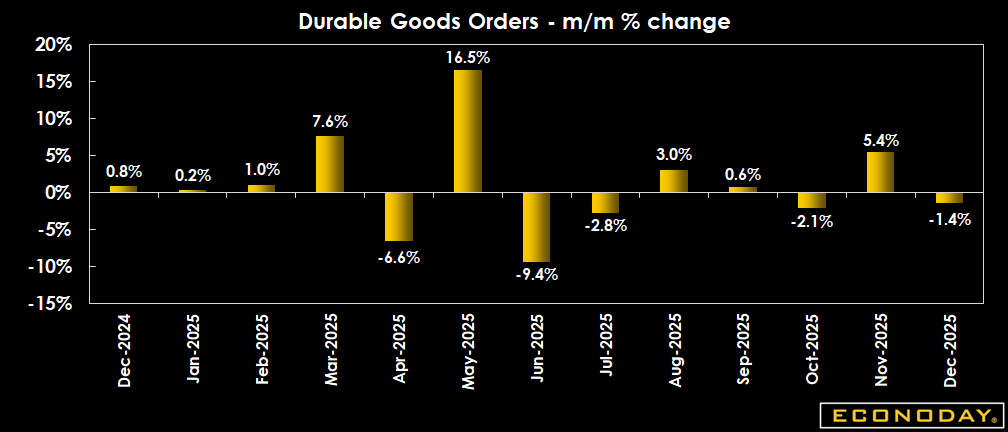
Highlights
Advance new orders for manufactured durable goods decreased 1.4 percent in December, a more resilient performance than the consensus expectation of a 2.3 percent decline in an Econoday survey of forecasters, following a 5.4 percent advance in November.
New orders for transportation contracted 5.3 percent in December, partly erasing the previous month's gain of 15.2 percent. Durables goods orders excluding transportation were also stronger than expected with a 0.9 percent monthly increase, compared to a consensus forecast of 0.3 percent, after rising 0.4 percent in November.
Excluding defense, new orders contracted 2.5 percent after growing 6.6 percent in November.
New orders were up in primary metals (1.7 percent), fabricated metal products (0.9 percent), machinery (0.3 percent) and computers and electronic products (3.0 percent).
Core capital goods orders (excluding defense and aircraft) a proxy for capital spending expanded a further 0.6 percent in December after gains of 0.8 percent and 0.5 percent, respectively, in November and October.
In December, unfilled orders were up 0.9 percent and shipments recovered 1.0 percent after declining 0.3 percent the previous month. Total inventories edged up 0.2 percent, the same pace as in November and October.
Market Consensus Before Announcement
Durable goods orders expected to decrease 2.3 percent on the month in December reflecting a drop in Boeing aircraft orders. The consensus sees an increase of 0.3 percent ex-transportation orders. Core capital goods orders are seen up 0.2 percent.
* Originally scheduled for 1/28/2026
Definition
Durable goods orders are new orders placed with domestic manufacturers for factory hard goods. The report also contains information on shipments, unfilled orders and inventories. The advance release provides early estimates and is revised about a week later by the factory orders report.
Description
Investors want to keep their finger on the pulse of the economy because it usually dictates how various types of investments will perform. Rising equity prices thrive on growing corporate profits - which in turn stem from healthy economic growth. Healthy economic growth is not necessarily a negative for the bond market, but bond investors are highly sensitive to inflationary pressures. When the economy is growing too quickly and cannot meet demand, it can pave the road for inflation. By tracking economic data such durable goods orders, investors will know what the economic backdrop is for these markets and their portfolios.
Orders for durable goods show how busy factories will be in the months to come, as manufacturers work to fill those orders. The data not only provide insight to demand for items such as refrigerators and cars, but also business investment such as industrial machinery, electrical machinery and computers. If companies commit to spending more on equipment and other capital, they are obviously experiencing sustainable growth in their business. Increased expenditures on investment goods set the stage for greater productive capacity in the country and reduce the prospects for inflation.
Durable goods orders tell investors what to expect from the manufacturing sector, a major component of the economy, and therefore a major influence on their investments.
Importance
Durable goods orders are a leading indicator of industrial production and capital spending.
Interpretation
The bond market will rally (fall) when durable goods orders are weak (strong). A moderately healthy report for new orders bodes well for corporate profits and the stock market, however. Durable goods orders are one of the most volatile economic indicators reported in the month and this series can be revised by significant amounts from one month to the next. More than any other indicator, it is imperative to follow either three-month moving averages of the monthly levels or year-over-year percent changes. These adjustments smooth out the monthly variability and provide a clearer picture of the trend in the manufacturing sector.
Whenever economic indicators are particularly volatile, it becomes customary to exclude the more variable components from the total. For instance, market players exclude defense orders and transportation orders from durable goods because these fluctuate more than the overall total. Incidentally, aircraft orders are the guilty culprit, which are included in both of these categories. Airplanes are ordered in quantity, not one at a time. Analysts exclude the categories containing aircraft orders because they obscure the underlying trend, not because the aircraft industry is unimportant.
Economists closely watch nondefense capital goods orders as a leading indicator of capital spending. Typically, traders follow the special series for nondefense capital goods excluding aircraft because it shows the underlying trend for equipment investment after discounting sharp swings from aircraft orders.
Durable goods orders are measured in nominal dollars. Economic performance depends on real, rather than nominal growth rates. One can compare the trend growth rate in durable goods orders with that of the PPI for finished goods to assess the growth rate in real orders.