| Consensus | Consensus Range | Actual | Previous | |
| CPI - M/M | -0.1% | -0.3% to 0.1% | -0.4% | 0.5% |
| CPI - Y/Y | 3.8% | 3.6% to 4.0% | 3.5% | 4.2% |
| Ex-Food & Energy- M/M | 0.2% | 0.1% to 0.3% | 0.0% | 0.2% |
| Ex-Food & Energy- Y/Y | 2.9% | 2.8% to 2.9% | 2.6% | 2.9% |
Highlights
The U.S. inflation story remains one where energy prices influence the headline CPI. The June CPI report shows the deflationary impact of the brief pause in the Iran conflict, with the drop in energy prices responsible for the headline contraction. On the political front, the unpopularity of AI data centers and their impact on electricity bills is not helped by this report – electricity costs are higher by 4.0 percent compared to a year ago, and food prices remain elevated.
Core consumer prices (excluding food and energy) were flat but remained above the Federal Reserve’s 2 percent on an annual basis.
The resumption of the Middle East war means the June CPI data is likely just a one-month reprieve and does not close the door to future interest rate increases. The Fed will need to see sustained evidence that inflation is no longer persistently elevated.
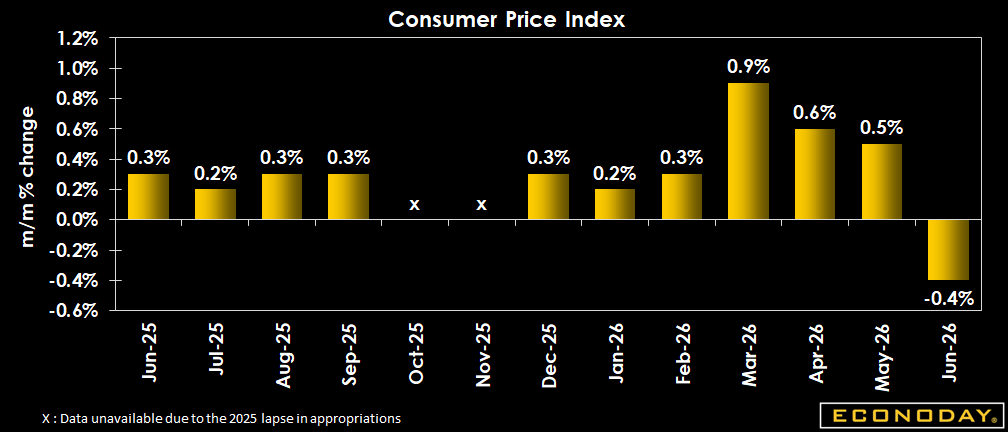
The Consumer Price Index in June decline by 0.4 percent, falling off the 0.5 percent pace set in May, and +0.6 percent in April. The June CPI reading beat expectations for a 0.1 percent dip in the Econoday survey of forecasters.
Over the last 12 months, consumer prices are up 3.5 percent, compared to a 4.2 percent rise in May. Expectations in the Econoday survey were for a 3.8 percent spike.
Core CPI, excluding food and energy prices, was unchanged in June, following a 0.2 percent increase in May. Consumer prices less food and energy rose 2.6 percent from June 2025, following a 2.9 percent year-over-year rise in May and matching the +2.9 percent expected in the Econoday survey.
Energy costs fell 5.7 percent, following a 3.9 percent jump in May – dragged down by a 9.7 percent drop in gasoline prices.
Energy prices are still up 15.7 percent year-over-year, following a 23.5 percent increase for the 12 months ending May. Gasoline prices jumped 26.7 percent last month compared to a year ago.
After a 0.3 percent increase in May, shelter costs picked up by 0.1 percent in June (and are up 3.3 percent year-over-year). The one-month change is the smallest since January 2021.
Food prices were up 0.2 percent, matching the pace set in May. Grocery prices increased by 0.2 percent on a monthly basis in June and are +2.7 percent compared to a year ago, and restaurant prices rose 0.2 percent and surged 3.4 percent compared to June 2025.
Food prices overall increased by 3.0 percent compared to June 2025, following a 3.1 percent rise in May.
Market Consensus Before Announcement
Falling gas prices on the month should depress the monthly figure to show a decline of 0.1 percent with the year-year at 3.8 percent versus 4.2 percent in May. Core seen up 0.2 percent and 2.9 percent, respectively. If not for the rebound in energy prices in the last few days, these might have been reassuring numbers for the markets and the Fed.
Definition
The CPI is a measure of the change in the average price level of a fixed basket of goods and services purchased by consumers. Monthly changes in the CPI represent the rate of inflation for the consumer. Annual inflation is also closely watched.
The consumer price index is available nationally by expenditure category and by commodity and service group for all urban consumers (CPI-U) and wage earners (CPI-W). All urban consumers are a more inclusive group. The CPI-U is the more widely quoted of the two, although cost-of-living contracts for unions and Social Security benefits are usually tied to the CPI-W, because it has a longer history. Monthly variations between the two are slight.
The CPI is also available by size of city, by region of the country, for cross-classifications of regions and population-size classes, and for many metropolitan areas. The regional and city CPIs are often used in local contracts.
The Bureau of Labor Statistics also produces a chain-weighted index called the Chained CPI. This measures a variable basket of goods and services whereas the regular CPI-U and CPI-W measure a fixed basket of goods and services. The Chained CPI is similar to the personal consumption expenditure price index that is closely monitored by the Federal Reserve Board.
Description
The consumer price index is the most widely followed monthly indicator of inflation. An investor who understands how inflation influences the markets will benefit over those investors that do not understand the impact.
Inflation is an increase in the overall prices of goods and services. The relationship between inflation and interest rates is the key to understanding how indicators such as the CPI influence the markets- and your investments.
If someone borrows $100 dollars from you today and promises to repay it in one year with interest, how much interest should you charge? The answer depends largely on inflation as you know the $100 will not be able to buy the same amount of goods and services a year from now. The CPI tells us that prices rose 4.2 percent in the U.S. over 2007. To recoup your purchasing power, you would have to charge 4.2 percent interest. You might want to add one or two percentage points to cover default and other risks, but inflation remains the key factor behind the interest rate you charge.
Inflation (along with various risks) basically explains how interest rates are set on everything from your mortgage and auto loans to Treasury bills, notes and bonds. As the rate of inflation changes and as expectations on inflation change, the markets adjust interest rates. The effect ripples across stocks, bonds, commodities, and your portfolio, often in a dramatic fashion.