| Consensus | Consensus Range | Actual | Previous | |
| CPI - M/M | 0.9% | 0.8% to 1.3% | 0.9% | 0.3% |
| CPI - Y/Y | 3.4% | 2.6% to 3.8% | 3.3% | 2.4% |
| Ex-Food & Energy- M/M | 0.3% | 0.2% to 0.4% | 0.2% | 0.2% |
| Ex-Food & Energy- Y/Y | 2.7% | 2.6% to 2.8% | 2.6% | 2.5% |
Highlights
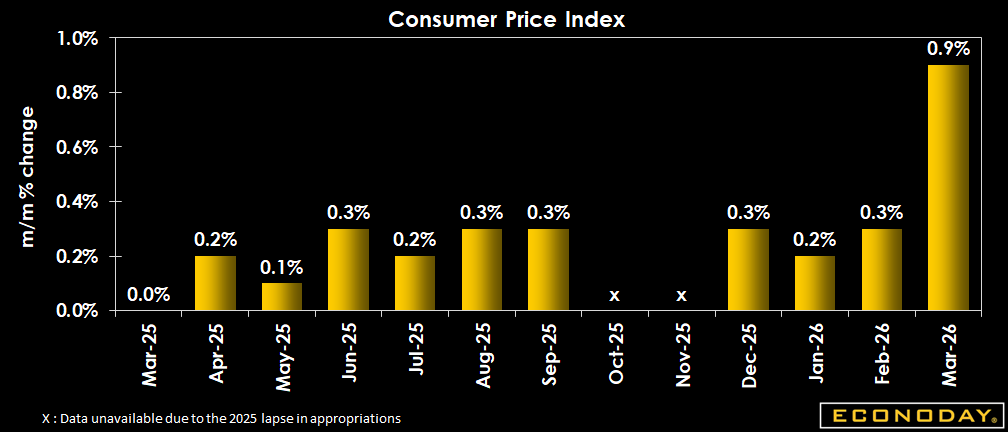
The March all-items CPI jumps 0.9 percent higher from the prior month and is up 3.3 percent compared to a year ago. The monthly increase matches the consensus of up 0.9 percent in the Econoday survey of forecasters. The year-over-year gain is just below the consensus of up 3.4 percent. The March CPI excluding food and energy is up 0.2 percent compared to February and the year-over-year increase is 2.6 percent. This is just below the consensus of up 0.3 percent for the monthly rise and 2.7 percent for the annual increase in the survey.
The CPI all-items rise is well anticipated due to the known surge in energy prices in March. The CPI for energy is up 10.9 percent in March from February and up 12.5 percent from a year ago. Within energy, the index for gasoline soars 21.2 percent in March from the prior month and is up 18.9 percent compared to a year ago.
The CPI less energy only is up 0.2 percent in March from February and up 2.6 percent compared to March 2025.
The March data see an outsized impact from energy prices that should be a one-off that will fade rapidly. However, it will likely leave household energy costs elevated for some time and will cut into consumer discretionary spending. It will also mean that Fed policymakers will have to try to determine just how large and long-lasting the ripples from higher energy prices will be for the inflation outlook. A majority of Fed policymakers will want more than one month's data to make that determination and will remain cautious about cutting the fed funds target rate until the uncertainty subsides.
Nonetheless, outside of the energy component most other categories for consumer prices continued moderate in prices with the important exception of housing. The CPI for commodities is up 2.0 percent month-over-month in March and up 3.4 percent compared to a year ago. The CPI for services is steady at up 0.2 percent in March from February and up 3.1 percent compared to a year ago. The CPI special aggregate of services less rent of shelter is steady at up 0.3 percent in March from February and on trend at up 3.4 percent year-over-year. Disinflation in services is happening but not as much for shelter costs which account for about 1/3 of the CPI basket of goods.
Market Consensus Before Announcement
The consensus sees CPI up a huge 0.9 percent on the month and an uncomfortable 0.3 percent excluding food and energy. The consensus sees CPI up 3.4 percent on year and 2.7 percent ex-food and energy. Retail gas prices have been reported up 25 percent for March and everyone is watching to see how much the energy shock spreads. These numbers keep the Fed on hold for now and considering rate hikes if it persists.
Definition
The CPI is a measure of the change in the average price level of a fixed basket of goods and services purchased by consumers. Monthly changes in the CPI represent the rate of inflation for the consumer. Annual inflation is also closely watched.
The consumer price index is available nationally by expenditure category and by commodity and service group for all urban consumers (CPI-U) and wage earners (CPI-W). All urban consumers are a more inclusive group. The CPI-U is the more widely quoted of the two, although cost-of-living contracts for unions and Social Security benefits are usually tied to the CPI-W, because it has a longer history. Monthly variations between the two are slight.
The CPI is also available by size of city, by region of the country, for cross-classifications of regions and population-size classes, and for many metropolitan areas. The regional and city CPIs are often used in local contracts.
The Bureau of Labor Statistics also produces a chain-weighted index called the Chained CPI. This measures a variable basket of goods and services whereas the regular CPI-U and CPI-W measure a fixed basket of goods and services. The Chained CPI is similar to the personal consumption expenditure price index that is closely monitored by the Federal Reserve Board.
Description
The consumer price index is the most widely followed monthly indicator of inflation. An investor who understands how inflation influences the markets will benefit over those investors that do not understand the impact.
Inflation is an increase in the overall prices of goods and services. The relationship between inflation and interest rates is the key to understanding how indicators such as the CPI influence the markets- and your investments.
If someone borrows $100 dollars from you today and promises to repay it in one year with interest, how much interest should you charge? The answer depends largely on inflation as you know the $100 will not be able to buy the same amount of goods and services a year from now. The CPI tells us that prices rose 4.2 percent in the U.S. over 2007. To recoup your purchasing power, you would have to charge 4.2 percent interest. You might want to add one or two percentage points to cover default and other risks, but inflation remains the key factor behind the interest rate you charge.
Inflation (along with various risks) basically explains how interest rates are set on everything from your mortgage and auto loans to Treasury bills, notes and bonds. As the rate of inflation changes and as expectations on inflation change, the markets adjust interest rates. The effect ripples across stocks, bonds, commodities, and your portfolio, often in a dramatic fashion.