| Consensus | Consensus Range | Actual | Previous | |
| CPI - M/M | 0.3% | 0.1% to 0.3% | 0.2% | 0.3% |
| CPI - Y/Y | 2.5% | 2.3% to 2.8% | 2.4% | 2.7% |
| Ex-Food & Energy- M/M | 0.3% | 0.2% to 0.4% | 0.3% | 0.2% |
| Ex-Food & Energy- Y/Y | 2.5% | 2.5% to 2.6% | 2.5% | 2.6% |
Highlights
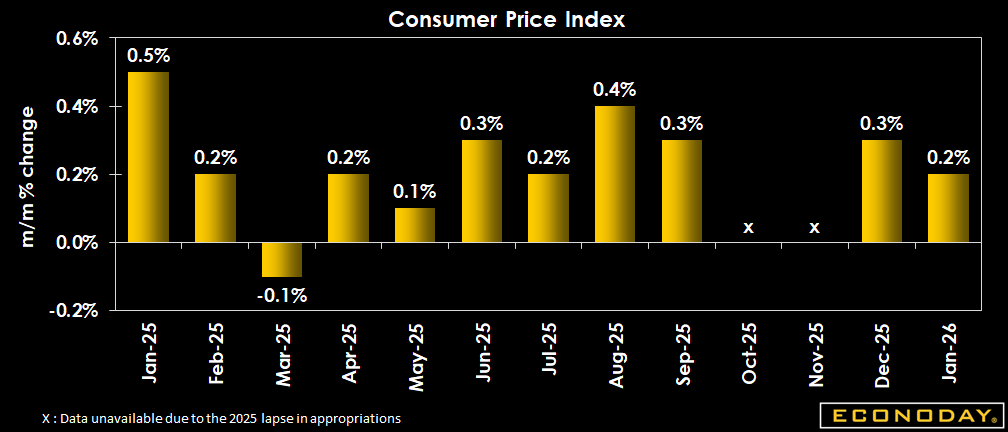
The January consumer price index (CPI) shows signs of broadly lessening price pressures at the consumer level. This suggests that impact of tariffs has largely finished passing through to the consumer level. Fed policymakers can be more confident that the process of disinflation has resumed and that inflation is returning to the 2 percent inflation objective.
The January CPI is up 0.2 percent month-over-month, slightly below the consensus of up 0.3 percent in the Econoday survey of forecasters. The year-over-year increase is 2.4 percent in January, down three-tenths from December. The core CPI is up 0.3 percent in January from December, slightly above the consensus of up 0.2 percent in the survey. The CPI excluding food and energy is up 2.5 percent compared to January 2025 and is down a tenth from the December reading.
The January report includes annual revisions that go back five years.
Food and beverage prices are up 0.2 percent in January from December, a slower pace than the up 0.6 percent in December. Food prices are up 2.8 percent compared to a year ago. Energy prices are down 1.5 percent in January from December after an increase of 0.3 percent in the prior month. The January decline is mainly from a 3.2 percent drop in gasoline prices. Energy prices are down 0.1 percent from January 2025.
Shelter costs account for about 1/3 of the CPI basket of goods and services. The index for shelter is up 0.2 percent in January from December, moderating from up 0.4 percent in December from November. The shelter index is up 3.0 percent in January from a year ago compared to up 3.2 percent in December.
Recent upward price pressures for commodities which are largely attributed to tariffs are abating. The index for commodities is down 0.2 percent in January from December after rising 0.2 percent in December from November. Commodities prices are up 1.0 percent from January 2025, a sharp slowing from up 1.7 percent in December's year-over-year reading. The services index is up 0.4 percent in January from December after up 0.3 percent in December from November. The services index is up 3.2 percent year-over-year in January compared to up 3.3 percent in December. Services prices are not declining as rapidly as commodities but are moderating incrementally.
Market Consensus Before Announcement
The consensus looks for stable inflation readings with CPI up 0.3 percent for total and core on the month and up 2.5 percent from a year ago for both total and core.
Definition
The CPI is a measure of the change in the average price level of a fixed basket of goods and services purchased by consumers. Monthly changes in the CPI represent the rate of inflation for the consumer. Annual inflation is also closely watched.
The consumer price index is available nationally by expenditure category and by commodity and service group for all urban consumers (CPI-U) and wage earners (CPI-W). All urban consumers are a more inclusive group. The CPI-U is the more widely quoted of the two, although cost-of-living contracts for unions and Social Security benefits are usually tied to the CPI-W, because it has a longer history. Monthly variations between the two are slight.
The CPI is also available by size of city, by region of the country, for cross-classifications of regions and population-size classes, and for many metropolitan areas. The regional and city CPIs are often used in local contracts.
The Bureau of Labor Statistics also produces a chain-weighted index called the Chained CPI. This measures a variable basket of goods and services whereas the regular CPI-U and CPI-W measure a fixed basket of goods and services. The Chained CPI is similar to the personal consumption expenditure price index that is closely monitored by the Federal Reserve Board.
Description
The consumer price index is the most widely followed monthly indicator of inflation. An investor who understands how inflation influences the markets will benefit over those investors that do not understand the impact.
Inflation is an increase in the overall prices of goods and services. The relationship between inflation and interest rates is the key to understanding how indicators such as the CPI influence the markets- and your investments.
If someone borrows $100 dollars from you today and promises to repay it in one year with interest, how much interest should you charge? The answer depends largely on inflation as you know the $100 will not be able to buy the same amount of goods and services a year from now. The CPI tells us that prices rose 4.2 percent in the U.S. over 2007. To recoup your purchasing power, you would have to charge 4.2 percent interest. You might want to add one or two percentage points to cover default and other risks, but inflation remains the key factor behind the interest rate you charge.
Inflation (along with various risks) basically explains how interest rates are set on everything from your mortgage and auto loans to Treasury bills, notes and bonds. As the rate of inflation changes and as expectations on inflation change, the markets adjust interest rates. The effect ripples across stocks, bonds, commodities, and your portfolio, often in a dramatic fashion.