| Consensus | Consensus Range | Actual | Previous | |
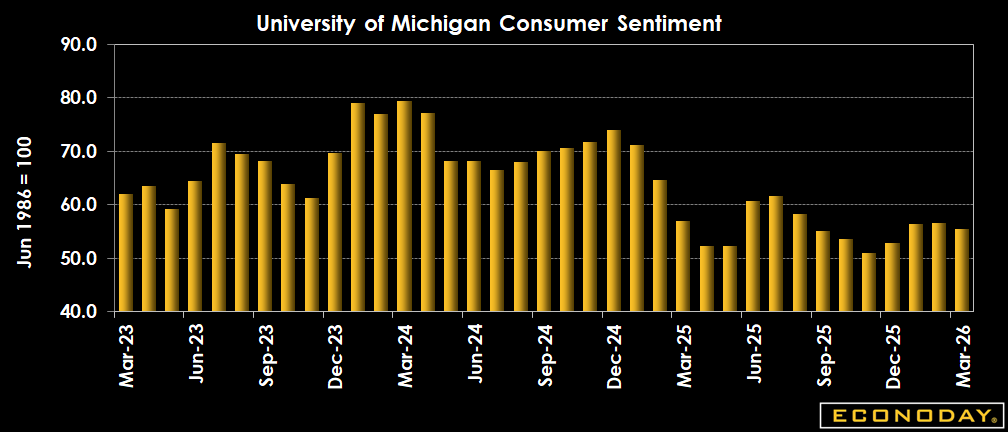
| Index | 56.2 | 53.0 to 57.5 | 55.5 | 56.6 |
| Year-ahead Inflation Expectations | 3.4% | 3.4% |
Highlights
U.S. consumer sentiment fell this month, with March's preliminary reading coming in at 55.5 vs. 56.6 in February and 56.4 in January. This is below the consensus of 56.2 in the Econoday survey of forecasters. The decline in confidence comes as consumer sentiment fell about 2 percent from February, dragged down by the impact of the Iran war.
Sentiment is down 2.6 percent from March 2025.
Interviews completed prior to the military action in Iran showed an improvement in sentiment from last month, but lower readings seen during the nine days thereafter completely erased those initial gains, the report noted. Gasoline prices have exerted the most immediate impact felt by consumers, though the magnitude of pass-through to other prices remains highly uncertain.
A broad swath of consumers across incomes, age, and political affiliation all reported declines in expectations for their personal finances, down 7.5 percent nationally, it added.
Preliminary year-ahead inflation expectations remained at 3.4 percent in March from February. The current reading exceeds those seen in 2024 and remains well above the 2.3-3.0% range seen in the two years pre-pandemic, the report said.
Long-run inflation expectations in March dipped to 3.2 percent from 3.3 percent last month. This remains above the 2.8 percent and 3.2 percent range seen in 2024.
Note that for both time horizons, interviews completed after February 28th exhibited higher inflation expectations than those completed before that date, the report said.
Market Consensus Before Announcement
Forecasters expect sentiment nearly unchanged at a relatively gloomy 56.2 in the initial March report versus 56.6 in the final for February.
Definition
The University of Michigan's Consumer Survey Center questions households each month on their assessment of current conditions and expectations of future conditions. Preliminary estimates for a month are released at mid-month and are based on about 420 respondents. Final estimates are released near the end of the month and are based on about 600 respondents.
Description
The pattern in consumer attitudes and spending is often the foremost influence on stock and bond markets. For stocks, strong economic growth translates to healthy corporate profits and higher stock prices. For bonds, the focus is whether economic growth goes overboard and leads to inflation. Ideally, the economy walks that fine line between strong growth and excessive (inflationary) growth.
This balance was achieved through much of the nineties and, in large part because of this, investors in the stock and bond markets enjoyed huge gains. It was during the late nineties that the consumer sentiment index hit its historic peak, reaching levels that were never matched during the subsequent 2001 to 2007 expansion nor during the long expansion following the Great Recession.
Consumer spending accounts for more than two-thirds of the economy, so the markets are always dying to know what consumers are up to and how they might behave in the near future. The more confident consumers are about the economy and their own personal finances, the more likely they are to spend. With this in mind, it's easy to see how this index of consumer attitudes gives insight to the direction of the economy. Just note that changes in consumer confidence and retail sales don't move in tandem month by month.