| Recent History | |||||||
| On Feed | Placements | Marketings | On Feed | ||||
| Month | Million Head | % YoY | Million Head | % YoY | Million Head | % YoY | 90+ Days |
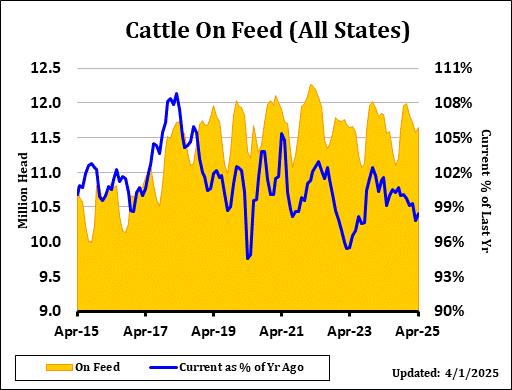
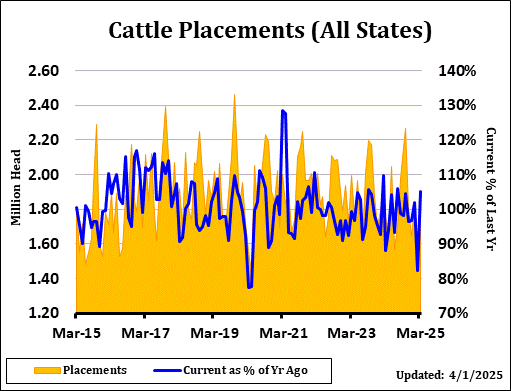
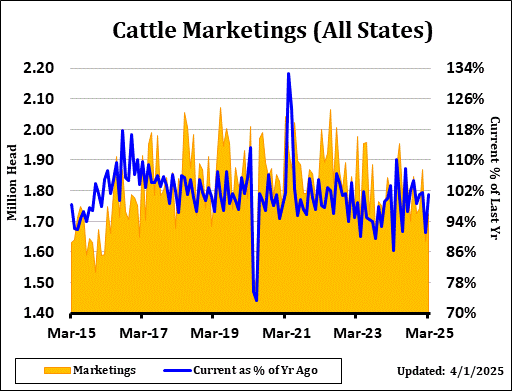
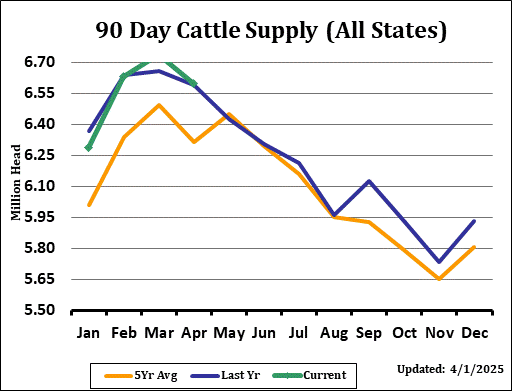
| Oct-24 | 11.600 | 100.0% | 2.266 | 104.4% | 1.845 | 104.7% | 5.932 |
| Nov-24 | 11.966 | 100.1% | 1.796 | 96.3% | 1.725 | 98.5% | 5.733 |
| Dec-24 | 11.982 | 99.7% | 1.642 | 96.7% | 1.742 | 101.0% | 5.930 |
| Jan-25 | 11.823 | 99.1% | 1.822 | 101.7% | 1.869 | 101.4% | 6.288 |
| Feb-25 | 11.716 | 99.3% | 1.554 | 82.2% | 1.633 | 91.1% | 6.630 |
| Mar-25 | 11.577 | 97.8% | 1.841 | 105.1% | 1.725 | 101.1% | 6.738 |
| Apr-25 | 11.638 | 98.4% | - | - | - | - | 6.596 |
| Cattle on Feed Estimates | |||||
| Estimates | |||||
| As Of | Average | Low | High | Last Year | |
| On Feed | Apr | 98.2% | 97.5% | 99.2% | 101.5% |
| Placements | Mar | 103.4% | 99.0% | 106.7% | 88.0% |
| Marketings | Mar | 100.6% | 99.0% | 101.5% | 86.3% |
Highlights
Cattle on Feed supply as of April 1st came in at 98.4% of last year versus the average trade estimate of 98.2% with a range of 97.5% to 99.2%. The inventory included 7.26 million steers and steer calves, down slightly from the previous year and accounting for 62% of the total inventory.
Placements for March were 105.1% versus trade expectations of 103.4% and a range of 99.0% to 106.7%. Net placements were 1.79 million head. Marketings for March were 101.1% of last year as compared with the average estimate of 100.6% and a range of 99.0% to 101.5%. Other disappearance totaled 55,000 head during March, 4% below last year.
The report can be considered mostly neutral with a minor bearish lean due to placements coming in slightly above the average guess. Live cattle and feeders this week were very strong ahead of the report. Although the report may result in some minor long liquidation Monday morning, it is not likely bearish enough to push the cattle significantly lower by itself. Cash trade later this afternoon is likely to be stronger than last week, but this week's futures price rally has resulted in overbought conditions for the short-term. A correction is due, but tight cattle supplies and strong feeder auction results will support pullbacks.
Definition
This file contains the monthly total number of cattle and calves on feed, placements, marketings, and other disappearances; by class and feedlot capacity for selected states; number of feedlots and fed cattle marketings by size groups for selected states. Data is organized by state and by U.S.
Description
This report offers a timely update on the current makeup of the beef cattle herd. It is probably the most-watched of the USDA reports for the cattle markets and can be a market-moving event if it contains a surprise. The marketings number provides an indicator of recent demand and has the ability to affect the price of nearby futures contracts. The placements number offers insight on the future supply of market ready cattle and has a tendency to affect the deferred contracts. Cattle are placed on feed for anywhere from 90 to 180 days, so a large placements number in June would project large market-ready supply in the fall. Both the placements and the marketings numbers inform the on feed number, which is a measure of current supply. The report offers state-by-state breakdowns as well by various weight groupings, providing an opportunity for further, in-depth analysis. Cattle on Feed reports are usually released on Friday afternoons after the cattle futures market closes, and the results will be reflected on the opening the following Monday morning.