https://www.cmegroup.com/content/dam/cmegroup/images/common/default/article-940x600.jpg
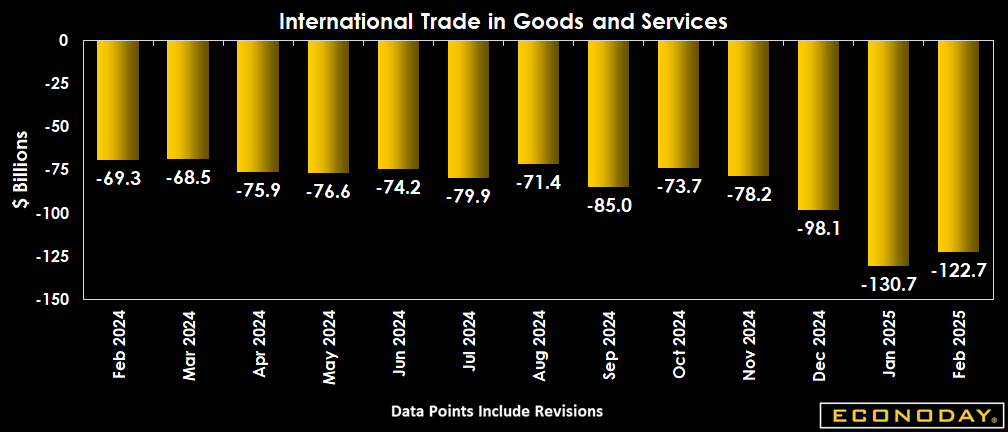
US: International Trade in Goods and Services
| Consensus | Consensus Range | Actual | Previous | Revised | |
| Balance | $-122.7B | $-132.0B to $-110.0B | $-122.7B | $-131.4B | $-130.7B |
Highlights
The international trade balance in goods and services is a deficit of $122.7 billion in February after a deficit of $130.7 billion in January which is a downward revision from the prior month. The February level matches the consensus of a deficit of $122.7 billion in the Econoday survey of forecasters. The trade balance for goods-only is a deficit of $147.0 billion in February, down 5.7 percent from January. The trade balance for services-only is a surplus of $24.3 billion in February, down 3.3 percent from January.
The composition of export and import activity reflects anticipation of higher tariffs and concerns about trade wars that will increase domestic prices and have a negative impact on supply chains. In particular, the demand for big-ticket hard goods and nonmonetary gold are moving the deficit.
Total exports of goods and services are up 2.9 percent in February from January to $278.5 billion. Exports of goods are up 4.8 percent in February from the prior month to $181.9 billion. Goods exports of industrial supplies are up $3.0 billion, including a $3.2 billion increase in nonmonetary gold. Exports of capital goods are up $2.7 billion, and automotive are up $1.6 billion. Exports of services are down 0.4 percent in February from the prior month to $96.5 billion. Exports of services are down $0.3 billion for transport and $0.3 for billion in travel.
Total imports of goods and services are virtually unchanged in February from January at $401.1 billion. Imports of goods are down 0.2 percent in February from the prior month to $328.9 billion. Imports of industrial supplies are down $4.2 billion, while consumer goods imports are up $1.5 billion and capital goods are up $1.0 billion. Imports of services are up 0.7 percent in February from the prior month to $72.2 billion. There are increase of $0.2 billion in travel $0.1 billion in the use of intellectual property.
Market Consensus Before Announcement
Forecasters look for goods & services trade gap at $122.7 billion in February versus $131.4 billion in January.
Definition
Updating the goods portion of the advance report and offering initial data on services, this report provides complete information on cross-border trade. Merchandise trade is available by export, import and trade balance for six principal end-use commodity categories and for more than one hundred principal commodity groupings. Data are also available for 48 countries and 7 geographic regions. Detailed information is reported on oil and motor vehicle imports. Services trade is available by export, import and trade balance for seven principal end-use categories.
Description
Changes in the level of imports and exports, along with the difference between the two (the trade balance) are a valuable gauge of economic trends here and abroad. While these trade figures can directly impact all financial markets, they primarily affect the value of the dollar in the foreign exchange market.
Imports indicate demand for foreign goods and services here in the U.S. Exports show the demand for U.S. goods in countries overseas. The dollar can be particularly sensitive to changes in the chronic trade deficit run by the United States, since this trade imbalance creates greater demand for foreign currencies. The bond market is also sensitive to the risk of importing inflation. This report gives a breakdown of U.S. trade with major countries as well, so it can be instructive for investors who are interested in diversifying globally. For example, a trend of accelerating exports to a particular country might signal economic strength and investment opportunities in that country.
Importance
The international trade balance on goods and services is the major indicator for foreign trade. While the trade balance (deficit) is small relative to the size of the economy (although it has increased over the years), changes in the trade balance can be quite substantial relative to changes in economic output from one quarter to the next.
Interpretation
Market reaction to this report is complex. Typically, the smaller the trade deficit, the more bullish for the dollar. Also, stronger exports are bullish for corporate earnings and the stock market.
Both the level and changes in the level of international trade indicate relevant information about the trends in foreign trade. Like most economic indicators, the trade balance is subject to substantial monthly variability, especially when oil prices change. It is more appropriate to follow either three-month or 12-month moving averages of the monthly levels.
It is also useful to examine the trend growth rates for exports and imports separately because they can deviate significantly. Trends in export activity reflect both the competitive position of American industry and the strength of domestic and foreign economic activity. U.S. exports will grow when: 1) U.S. product prices are lower than foreign product prices; 2) the value of the dollar is relatively weaker than that of foreign currencies; 3) foreign economies are growing rapidly.
Imports will increase when: 1) foreign product prices are lower than prices of domestically-produced goods; 2) the value of the dollar is stronger than that of other currencies; 3) domestic demand for goods and services is robust.
The international trade report does show bilateral trade balances with our major trading partners. Since the value of the dollar versus various foreign currencies does not always move in tandem, we can see a narrower or wider trade deficit with different countries. In the 1980s and 1990s, the U.S. trade deficit with Japan often caused political problems. During the next 20 years the deficit with China began to grow rapidly and, like Japan, once again caused political problems. While American consumers benefit from weak imports, American workers often lose their jobs as these goods are no longer produced in the United States. Ideally, the United States would be exporting (high end) goods that other countries don't produce.