| Consensus | Consensus Range | Actual | Previous | Revised | |
| Initial Claims - Level | 240K | 235K to 245K | 233K | 236K | 237K |
| Initial Claims - Change | -4K | -10K | -9K | ||
| 4-Week Moving Average | 241.5K | 245K | 245.25K |
Highlights
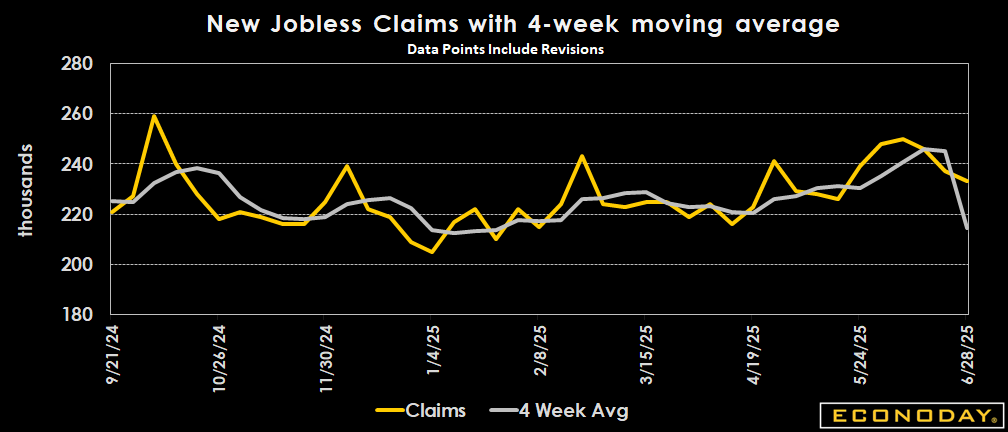
Initial claims numbers maintained their downward trend to end June. However, the persistently high level of continuing claims (above 1.9 million for the six straight week) adds to other jobs-related data released this week (ADT, non-farm payrolls, JOLTS) showing a slowdown in the pace of hiring, although not enough to swing the pendulum in favor of rate cuts at the next Federal Reserve meeting.
Initial jobless claims came in below expectations, with the level reported in the week ending June 28 down 4,000 from the revised 237,000 (previously 236,000) level reported for the prior week. The June 28 week's level compares to the consensus of 240,000 in the Econoday survey of forecasters. The four-week moving average is down 3,750 to 241,500 in the June 28 week.
Seasonal factors had expected an increase in unadjusted claims of 7,805 (+3.4 percent) from the previous week, but instead there was a smaller 4,032 (+1.8 percent) rise.
Massachusetts (+2,310), New Jersey (+4,583), and New York (+3,426) reported noticeable increases in unadjusted first-time claims. California (-2,421), Connecticut (-2,331), and Pennsylvania (-2,985) had significant declines.
Insured unemployment was unchanged in the June 21 week at 1.964 million the prior week's level was revised down from 1.974 million). However, continuing claims are higher by 100,000 compared to the same week a year ago, a sign of entrenched labor market's softness. The four-week moving average is up by 15,500 to 1.954 million, from a revised 1.938 million in the June 14 week. The insured rate of unemployment remained at 1.3 percent in the June 21 week from the prior week.
Market Consensus Before Announcement
Claims seen at 240 K versus 236 K in the previous week.
Definition
New unemployment claims are compiled weekly to show the number of individuals who filed for unemployment insurance for the first time. An increasing (decreasing) trend suggests a deteriorating (improving) labor market. The four-week moving average of new claims smooths out weekly volatility.
Description
Jobless claims are an easy way to gauge the strength of the job market. The fewer people filing for unemployment benefits, the more have jobs, and that tells investors a great deal about the economy. Nearly every job comes with an income that gives a household spending power. Spending greases the wheels of the economy and keeps it growing, so a stronger job market generates a healthier economy.
There's a downside to it, though. Unemployment claims, and therefore the number of job seekers, can fall to such a low level that businesses have a tough time finding new workers. They might have to pay overtime wages to current staff, use higher wages to lure people from other jobs, and in general spend more on labor costs because of a shortage of workers. This leads to wage inflation, which is bad news for the stock and bond markets. Federal Reserve officials are always on the look-out for inflationary pressures.
By tracking the number of jobless claims, investors can gain a sense of how tight, or how loose, the job market is. If wage inflation looks threatening, it's a good bet that interest rates will rise, bond and stock prices will fall, and the only investors in a good mood will be the ones who tracked jobless claims and adjusted their portfolios to anticipate these events.
Just remember, the lower the number of unemployment claims, the stronger the job market, and vice versa.