https://www.cmegroup.com/content/dam/cmegroup/images/common/default/article-940x600.jpg
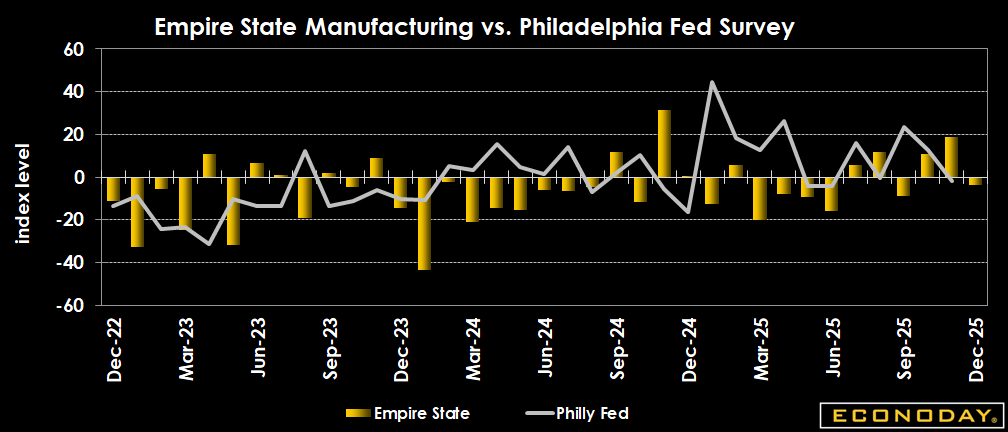
US: Empire State Manufacturing Index
| Consensus | Consensus Range | Actual | Previous | |
| Index | 10.0 | 5.0 to 15.4 | -3.9 | 18.7 |
Highlights
The New York Fed's Empire State manufacturing survey for December points to overall weaker current conditions while conditions about six months from now are solidly more positive. The general business conditions index is a diffusion index and therefore the report details can tell a different story than the headline. In December, the detail indexes present a mixed picture.
The December general business conditions index is minus 3.9 after 18.7 in November. The drop contrasts with the consensus of 10.0 in the Econoday survey of forecasters. The New York Fed index can be volatile and tends to alternate between firmer and softer readings. A two-month moving average suggests that underlying conditions remain positive if a bit softer with the average at 7.4 in December after 14.7 in November. The future conditions index jumps to 38.0 in December after 23.3 in November. The two-month moving average is 27.4 in December after 24.7 in November and has been trending higher for the past three months.
The new orders index is 0.0 in December after 15.9 in November and the order backlogs index is minus 14.9 after minus 5.8. Without new orders coming in, the already shrinking backlog orders is even less to sustain factory activity. Without new orders and no backlogs to fill, the index for shipments falls to minus 5.7 in December after 16.8 in November.
The delivery times index points to goods moving quickly through the supply chain at minus 5.9 in December after 7.7 in November. The inventories index points to some mild build up in stocks on hand at 4.0 in December, but less so than 6.6 in November.
The employment index suggests that manufacturers are hiring skilled workers where they can find them. The employment index is up to 7.3 in December after 6.6 in November. Factories are also lengthening the workweek, although more slowly. The average workweek index is 3.5 in December after 7.7 in November.
The index for prices paid moderated for a second month in a row at 37.6 in December from 49.0 in November. Some of this was due to lower energy costs. The index for prices received slips to 19.8 in December from 24.0 in November and is the lowest since 19.6 in February. Manufacturers are still passing on increased costs but at a slower pace.
Market Consensus Before Announcement
The consensus sees moderate but slower growth at 10.0 for December versus 18.7 in November.
Definition
The New York Fed conducts this monthly survey of manufacturers in New York State. Participants from across the state represent a variety of industries. On the first of each month, the same pool of roughly 200 manufacturing executives (usually the CEO or the president) is sent a questionnaire to report the change in an assortment of indicators from the previous month. Respondents also give their views about the likely direction of these same indicators six months ahead.
Description
Investors track economic data like the Empire State Manufacturing Survey to understand the economic backdrop for the various markets. The stock market likes to see healthy economic growth because that translates to higher corporate profits. The bond market prefers a moderate growth environment that won't generate inflationary pressures. The Empire Manufacturing Survey gives a detailed look at New York state's manufacturing sector, how busy it is and where things are headed. Since manufacturing is a major sector of the economy, this report has a big influence on the markets. Some of the Empire State Survey sub-indexes also provide insight on commodity prices and other clues on inflation. The Federal Reserve closely watches this report because when inflation signals are flashing, policymakers can reset the direction of interest rates. As a consequence, the bond market can be highly sensitive to this report. The equity market is also sensitive to this report because it is the first clue on the nation's manufacturing sector, reported in advance of the Philadelphia Fed's business outlook survey.