Trading Simulator How-To Guide: Chart Time Frames
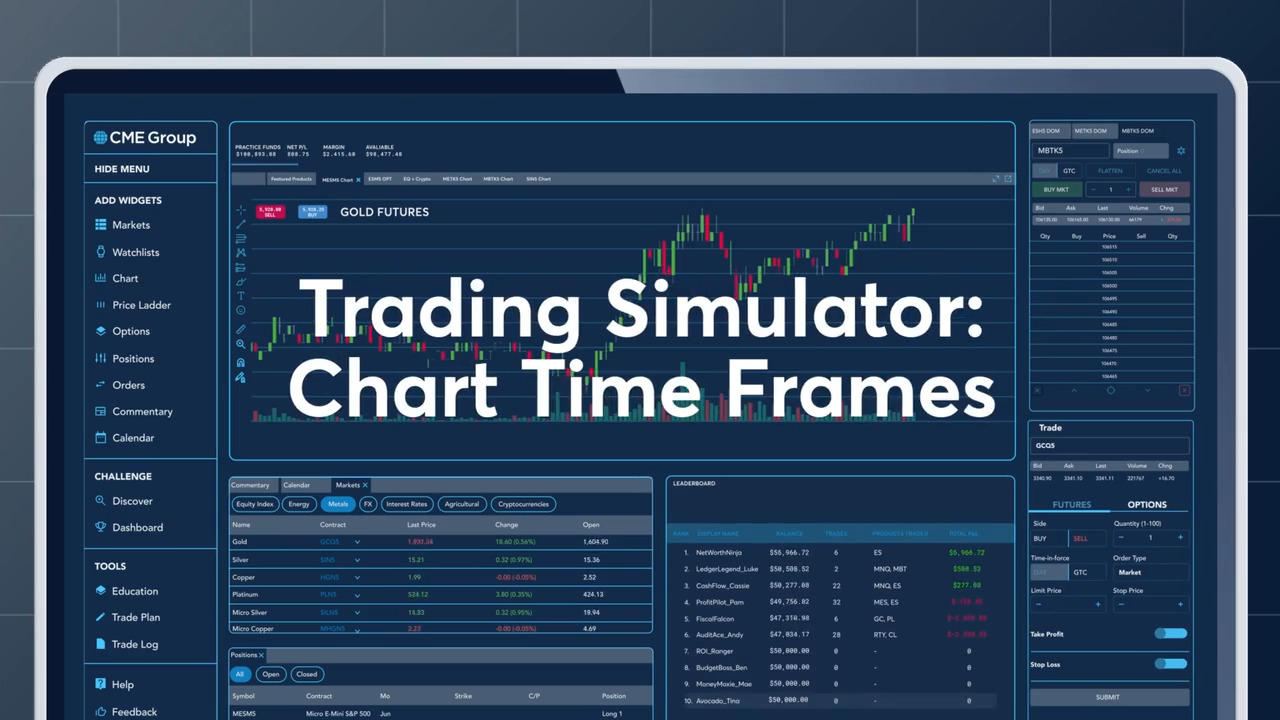
Chart time frames in the Trading Simulator
The Trading Simulator helps traders analyze markets and make informed decisions with various chart time frames (five-minute, one-hour, daily) for tailored strategies.
This lesson walks through several of the key time frames that traders often look at when they use the chart widget in the Trading Simulator.
5-minute chart: short-term trading
The 5-minute chart is helpful for traders who want to capture quick movements in the market. It shows detailed price action and can help you identify immediate trends and price movements. For example, if you're trading E-mini S&P 500 (ES) futures, you can use the 5-minute chart to spot intraday volatility. This chart is particularly useful for traders who are looking to capitalize on short-term market fluctuations and need a high level of detail to make quick decisions.
1-hour chart: intermediate trading
The 1-hour chart is ideal for intermediate traders looking to understand longer-term market behavior. This chart helps you identify significant support and resistance levels, and it's useful for setting up trades that align with the broader market trend. If you notice a strong upward trend on the 1-hour chart, you might decide to enter a long position, using the 5-minute chart to time your entry for optimal execution. This approach allows you to capture longer-term movements while still being able to react to short-term volatility.
Daily chart: long-term analysis
The daily chart is the go-to for long-term traders and analysts. It provides a broader view of market trends, helping you see the bigger picture and make strategic decisions. For instance, you can use the daily chart to identify long-term support and resistance levels, and to set long-term trading goals. The daily chart is also valuable for confirming the signals you see on shorter time frames, providing a gauge as to whether or not your short-term trades are aligned with the overall market direction.
Combining chart time frames for comprehensive strategies
By combining these chart timeframes, you can develop a comprehensive trading strategy that covers both short-term and long-term market movements. This approach helps you build the habit of thorough market analysis, a crucial skill for both new and experienced traders. For example, you might use the daily chart to identify a long-term trend, the 1-hour chart to confirm the trend's strength and the 5-minute chart to execute trades at the optimal entry points. This multi time frame analysis helps prepare you to handle the complexities of the market.
Practice and refine your skills
Remember, the Trading Simulator is designed to help you practice and refine your trading skills in a risk-free environment. Take advantage of the charting tools to enhance your understanding of market trends and improve your trading decisions.
For more information and to get started, visit the Trading Simulator.