Trading Simulator How-To Guide: Multichart View
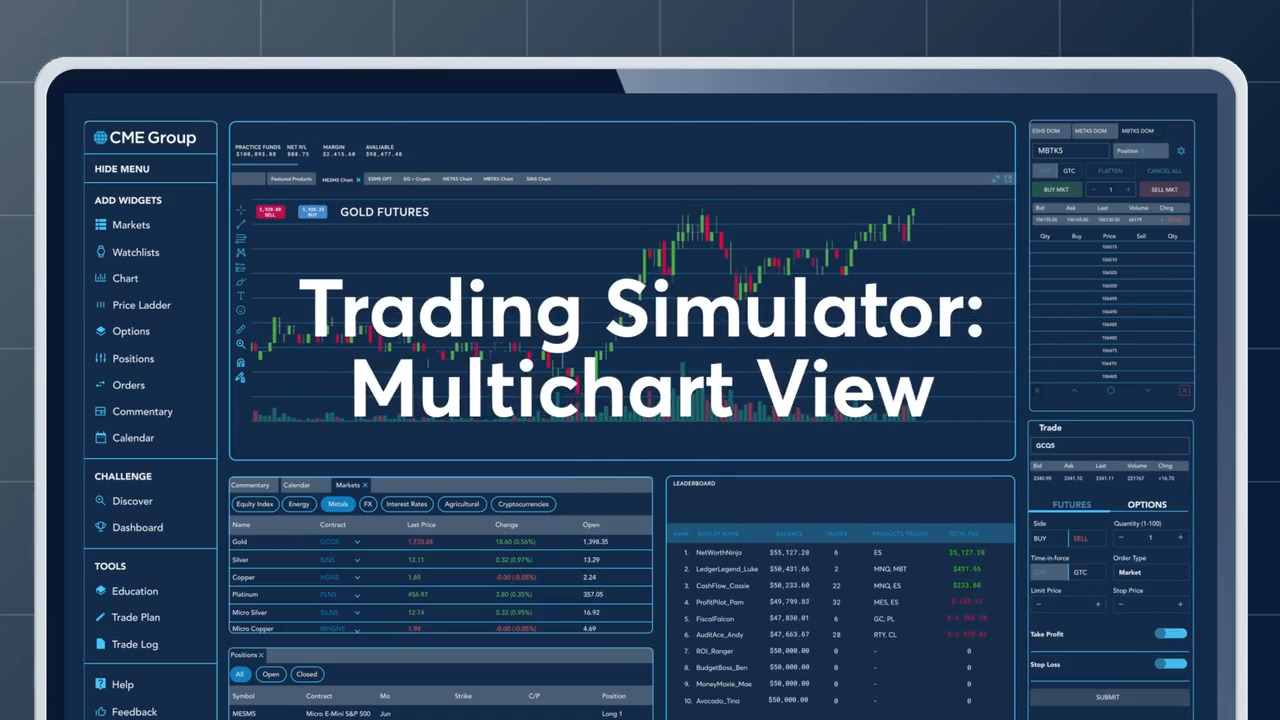
Understanding Multi-Chart Views in the CME Group Trading Simulator
Getting Started with the Trading Simulator
The Trading Simulator helps traders of all levels master the futures market in a risk-free environment. Upon login, a default workspace provides essential widgets like the Markets tab, Chart, Price Ladder, Commentary, and Economic Events for a comprehensive market view.
Adding and Customizing Charts
One of the most powerful features of the Trading Simulator is the ability to add and customize charts. To add a chart, simply click on the product you're interested in, and then select the "Chart" option. The Chart widget allows you to visualize historical and 10-minute-delayed price data using various time frames and chart types. You can choose from line charts, bar charts and candlestick charts, depending on your preference.
Customizing Your Workspace
To create a custom workspace, click the plus icon in the top navigation and name it. You can then drag and drop the desired widgets into your workspace, such as multiple charts, a Price Ladder and Orders. This setup is particularly beneficial for active traders who need to monitor and react to multiple markets quickly. With up to 10 custom workspaces, you can tailor your environment to suit different trading scenarios and strategies.
The Power of Intermarket Analysis
The multi-chart view in the Trading Simulator is an invaluable tool for intermarket analysis. By viewing multiple charts simultaneously, you can identify correlations and trends that can inform your trading strategies. For example, you might want to compare the E-mini S&P 500 futures with the WTI Crude Oil futures to see how changes in oil prices affect the broader market.
Trading Example
Let's explore a couple of trading examples to illustrate the benefits of the multi-chart view. Suppose you're an active trader and you notice that the WTI Crude Oil futures are experiencing a significant price drop. You suspect this might impact the broader equity market, specifically E-mini S&P 500 futures. By opening both charts in the same workspace, you can monitor the price movements in both products and make informed decisions. If the price of WTI Crude Oil continues to fall and the E-mini S&P 500 futures start to follow, you might decide to take a position on the E-mini S&P 500 futures to protect your portfolio from potential losses.
Conclusion
Whether you're a beginner or an experienced trader, the multi-chart view and customizable workspaces in the CME Group Trading Simulator are invaluable tools for making informed trading decisions. By visualizing multiple markets and products simultaneously, you can harness the power of intermarket analysis and stay ahead of the curve. For more information and to start using the Trading Simulator, visit https://www.cmegroup.com/trading_tools/simulator.