Accessing CVOL on CME Direct
Real-time volatility index data can be a helpful tool to enhance your trading decisions. CME Group Volatility Index, or CVOL, is an addition to the CME Direct platform that enables you to do just this – view valuable volatility data for different asset classes at a glance.
- To add CVOL to your CME Direct platform:
- Go to the CVOL homepage and scroll down to “How to access”
- Under CME Direct, save the file named “Right-click to save the CVOL grid” as an .XML on your computer
- Open CME Direct
- At the top of CME Direct, click Menu > Import view then select the downloaded file
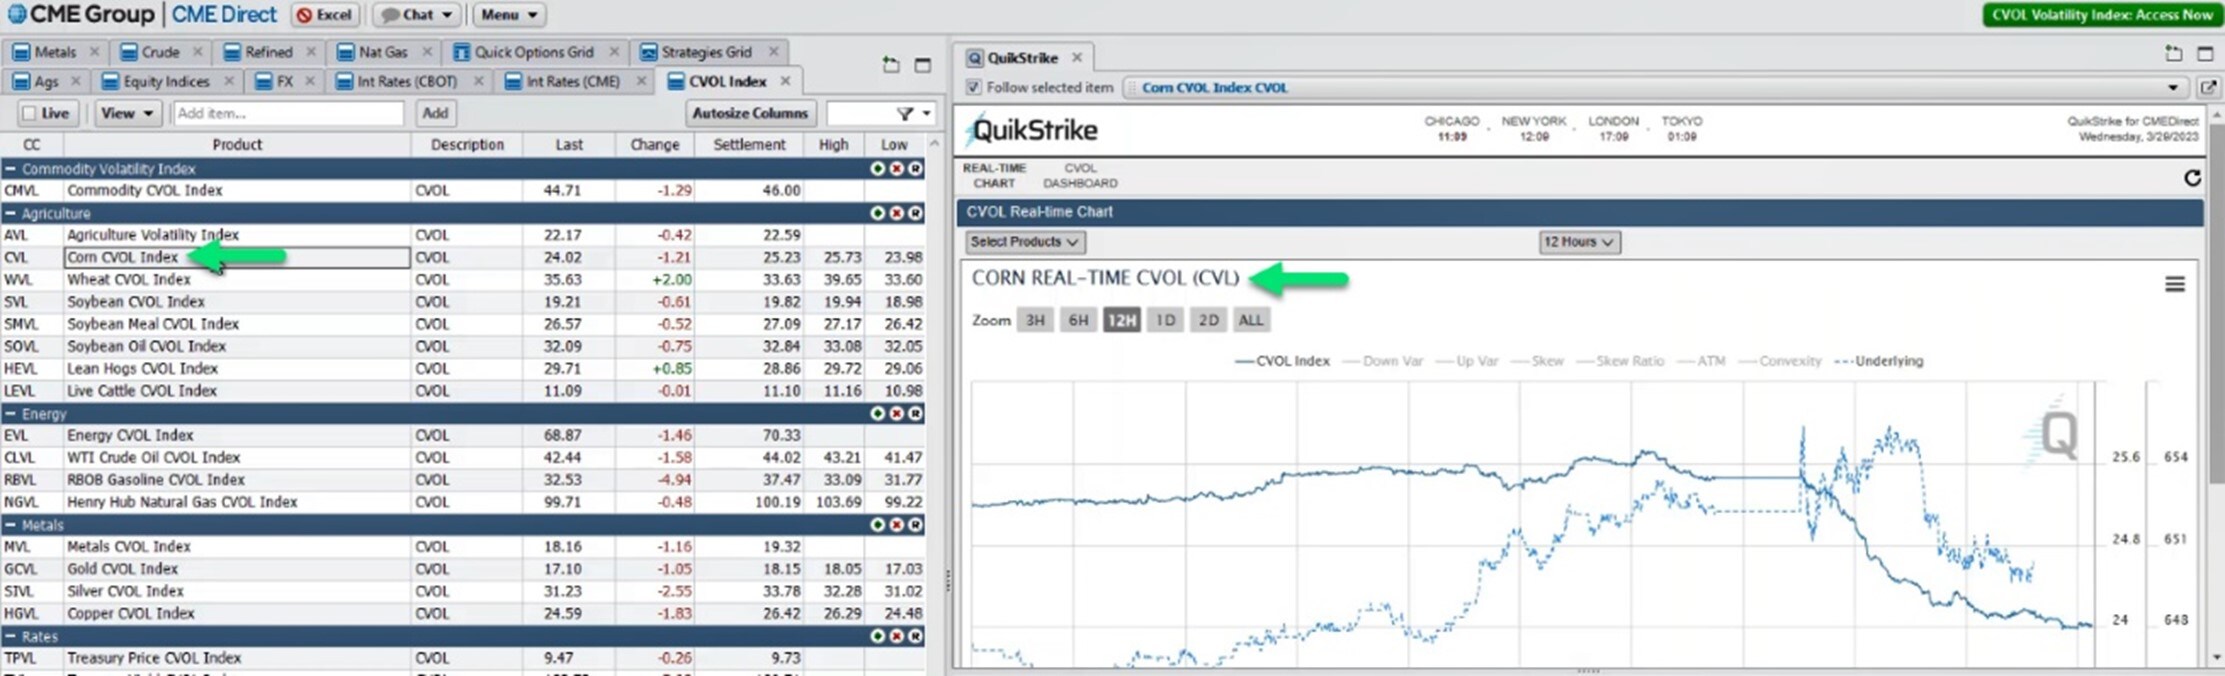
You should now see live market data for all CVOL indices across the five asset classes. To view data for a specific product, click the product in the grid and the CVOL chart will update accordingly with the latest real-time data. You can also further customize your view by adjusting timeframes, zoom level, and individual indicators.
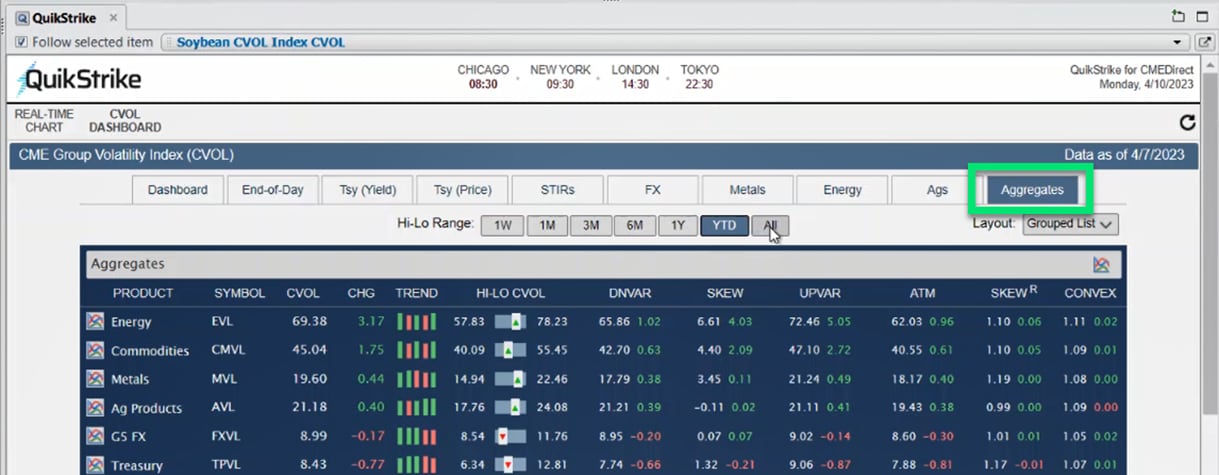
The CVOL dashboard displays the high and low CVOL range for each product. You can adjust the time frame on the dashboard to help you evaluate the current level of volatility as well as compare current volatility to historical highs and lows. Since CVOL is a standardized volatility measure, you can also compare volatility across different asset classes.
If you ever accidentally remove the CVOL tab, or if you'd like multiple QuikStrike tabs open at the same time:
- Click Menu
- Select “New View”
- Choose “QuikStrike” – a new tab will appear, and you can adjust your screen setup as needed